
Investors and traders are continuously looking for cutting-edge AI stock trading software and technologies to give them an edge. In the stock market, timing is crucial for making money. Even milliseconds can determine whether a trade is successful or not. To gain an edge, traders are now using AI and algorithmic trading systems like stock trading bots.
These automated systems can buy and sell stocks on exchanges very quickly, helping investors take advantage of opportunities and enhance their trading results. In this article, we will discuss what stock trading bots are, the various types available, tips for selecting one, and some of the top trading bots currently on the market.
What is an AI stock trading bot?
A stock trading bot is a computer program that uses data analysis to buy and sell stocks automatically. Also referred to as algo trading bots or automated trading systems, they offer investors a methodical and data-driven way to trade stocks.
The benefits of using stock trading bots include:
- Control over parameters
- Efficient high-speed trading
- Backtesting capabilities
- Risk management
- Diversification
By implementing an algorithmic trading strategy, investors can potentially enhance their portfolio performance and uncover profitable opportunities. Stock trading bots can quickly assess various price movements and provide insights into market trends that may be overlooked by humans.
Regardless of whether a trader follows a buy-and-hold or day trading strategy, stock trading bots can help optimize their approach by continuously monitoring market changes and adjusting their investments accordingly.
A significant advantage of using stock trading bots is that they enable traders to create and automate money management rules that execute trades based on specific criteria. By promoting a systematic and unbiased trading strategy, these tools help remove emotions from the decision-making process.
12 Best AI Stock Trading Bots
1. Trade Ideas

Ranked as the Best AI stock trading bot, Trade Ideas stands out for its impressive stock trading software developed by a team of talented financial technology entrepreneurs. The software is uniquely built by a team of US developers and directly connects to the Exchanges, monitoring real-time market behavior against historical data tick by tick. With dozens of investment algorithms, the AI stock trading bot ensures users can enhance their trading strategies.
Trade Ideas caters to investors of all levels, offering simulated training sessions for beginners, prebuilt AI trading management tools for intermediate traders, and customizable trade strategies with AI integration for experts. The company’s AI-Holly bot provides statistically-weighted Entry Signals and suggested Exit Signals based on various risk management levels for intraday trade handling.
Additionally, Trade Ideas features Full Quote Windows that display comprehensive fundamental data to help users grasp a stock’s price easily.
Features:
- Analyzes historical and real-time data
- Monitors a wide range of trading instruments
- Offers customizable strategies for traders
- Simulated trading
- Suggested Entry & Exit Signals
Pros:
- Extensive scanning capabilities
- Unique alert system
- Supportive community
Cons:
- Learning curve for beginners
- Premium cost
Pricing:
Trade Ideas provides both monthly and annual subscription options for its two subscription plans, Standard and Premium. The Premium plan costs $167 per month or $1999 annually, while the Standard plan is priced at $84 per month or $999 annually.
2. TrendSpider
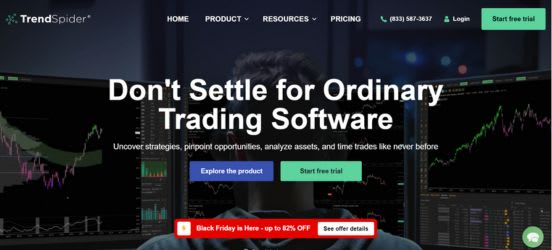
TrendSpider offers advanced automatic technical analysis through its unique machine learning algorithm on its stock market platform. The software is designed for all types of investors, from day traders to general market participants. By scanning historical market data, TrendSpider’s algorithm can identify trends in the forex market, which are then shared with human traders for making informed and profitable trades.
Additionally, TrendSpider provides Trading Bots that can automate your trading strategy. You can refine and test your strategy using the Strategy Tester feature before deploying it as a Trading Bot. These Bots are customizable to match your specific strategy and can be set to trigger actions based on certain conditions being met, such as posting to a private Discord server or executing trades in a brokerage account.
They operate on timeframes ranging from 15 minutes and up, do not have an expiration date, and run on a cloud-based system. Alongside Trading Bots, TrendSpider’s comprehensive platform also offers chart pattern recognition and trendline analysis. Its smart alerts and intuitive interface empower traders to navigate the market with precision.
TrendSpider is a renowned AI stock and crypto trading bot that streamlines market analysis for traders.
Features:
- Cutting-edge technology automates
- Dynamic alerts
- Multi-timeframe
Pros:
- Accurate technical analysis
- Customizable alerts
- Strategy optimization
Cons:
- Learning curve
- High cost
Pricing:
Three price tiers are available on TrendSpider: Elite, Elite Plus, and Essential. A seven-day free trial is included with every plan. The monthly cost of the Essential plan is $33.15, or $27.20 if paid annually. The monthly cost of the Elite is $89.50, or $67.50 if a yearly subscription is chosen.
3. Signal Stack

Signal Stack is an AI stock trading bot that analyzes vast market data to generate real-time signals. It adapts to traders’ preferences, offering customization options for criteria and indicators. Real-time signals are delivered through various channels, aiding quick decision-making. Comprehensive portfolio management tools assist in optimizing investment portfolios.
Features:
- Advanced AI algorithms
- Real-time signal generation
- Portfolio management
- Risk management
Pros:
- Automation,
- Data-driven insights
- Backtesting capabilities
Cons:
- Technical complexity for beginners
- Dependence on market conditions
Pricing:
Signal Stack Pricing is tier-based, offering lower costs per signal for larger purchases. You don’t need a credit card to access the first 25 signals, which are free. Pricing for subsequent signals starts at $1.49 for a pack of 50 and goes all the way down to $0.59 for a pack of 10,000.
4. Stock Hero
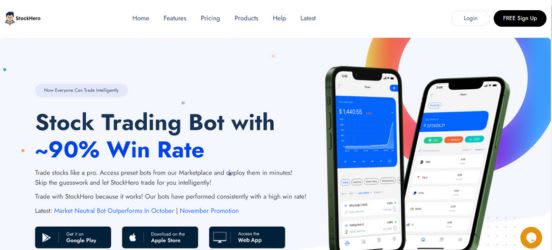
StockHero is an AI stock trading bot that employs cutting-edge technology to analyze vast market data, offering insights and automation to traders. It is a stock screening platform that helps traders identify undervalued stocks. It caters to both beginners and experienced traders, making stock market insights accessible to all.
Features:
- Advanced algorithms
- Real-time analysis
- Portfolio management tools
- Automation streamlines trade execution
Pros:
- Data-driven insights
- Efficient
- Risk management features
Cons:
- Reliant on market conditions
- Technical complexity
Pricing:
Stock Hero offers three subscription plans: the Lite plan at $4.99/month or $49.99/year; the Premium plan at $49.99/month or $499.99/year; and the Professional plan at $99.99/month or $999.99/year.
5. Tickeron
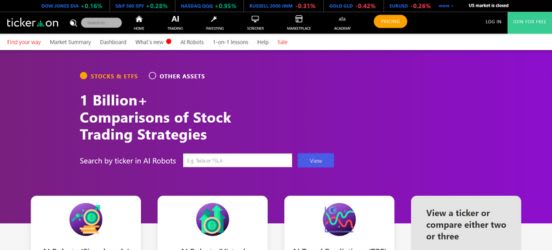
Tickeron is an AI stock trading platform that leverages advanced algorithms to analyze real-time and historical market data, aiding users in making data-driven investment decisions. It is a news and analysis platform that provides traders with news, analysis, and trading ideas.
Features:
- AI-driven insights
- Smart portfolios
- Backtesting
- Technical analysis tools
Pros:
- Advanced AI algorithms
- Diverse feature set
- User-friendly interface
Cons:
- Market unpredictability
- High cost
Pricing:
Tickeron offers four main pricing plans. The Investor plan costs $60/month, the Swing Trader plan is $80/month, the Day Trader plan at $100/month, and the Expert plan at $250/month.
6. Scanz
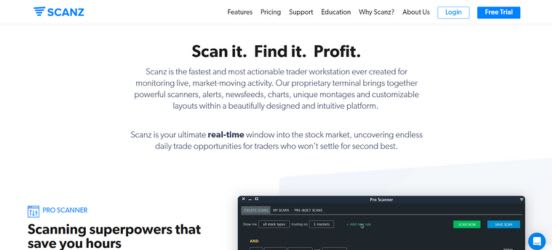
Scanz is a comprehensive market scanning platform designed for day and swing traders, offering real-time scans of the entire stock market. It helps traders identify trading opportunities on the forex market. It offers real-time scanning and filtering tools.
Features:
- Customize scans
- News Scanner with rapid news feeds
Pros:
- Robust scanning capabilities
- Real-time event notifications
Cons:
- Learning curve for new users
- Subscription costs
Pricing:
The monthly cost of Scanz includes Level 1 and Level 2 quotes, with a starting price of $169. For an extra $15 per month, you can get the OTC Markets add-on, which gives you complete data on OTC penny and sub-penny stocks.
7. Imperative Execution

Imperative Execution, a financial exchange organization, is renowned for its Intelligent Cross US equities ATS platform, which was a pioneer in applying AI to trading. It is an order execution platform that helps traders place and execute orders quickly and efficiently.
Features:
- Optimizing price discovery
- Near-instant order matching
Pros:
- Cutting-edge technology
- Swift order execution
Cons:
- Primary focus on U.S. Equities
- Potential dependency on AI technology
Pricing:
Imperative Execution, a leader in automated trading systems, offers its IntelligentCross ATS with a special pricing structure. Although precise pricing information is kept private, the company’s strategy aims to lessen the impact of large orders on the market and provide a more effective trading environment.
8. Algoriz
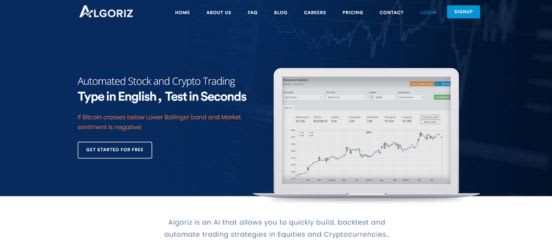
Algoriz is a cutting-edge trading platform that harnesses artificial intelligence and machine learning to provide traders with real-time insights and automated trading capabilities. It is a backtesting and optimization platform that helps traders develop and test their trading strategies.
Features:
- Advanced algorithms
- Trading opportunities
- Competitive edge
Pros:
- Time-saving efficiency
- Data-driven decision-making
- Trading discipline
Cons:
- Need technical knowledge
- Bot’s performance relies on market conditions
- Require dynamic environments
Pricing:
Four pricing tiers are available to users through Algoriz. For those just starting out, the Professional plan costs $29 per month and offers advanced features. The Lite plan is free. The Premium plan, which costs $69 a month, is for those looking for a complete trading solution.
9. Kavout

Kavout is an innovative AI investing platform powered by “Kai,” its AI machine that meticulously analyzes vast amounts of financial data, news, blogs, and social media to provide highly accurate insights.
Features:
- AI-powered stock selection
- Objective and tradable signals
- Broad coverage
Pros:
- AI-driven precision
- risk-free paper trading
Cons:
- Learning curve
- Market-dependent
Pricing:
Since Kavout’s pricing isn’t mentioned explicitly on its website, it might be customized to meet the needs of specific users.
10. BlackBoxStocks

Real-time trading alerts and advanced options tools with a trading community and AI algorithms for stock and options traders.
Features:
- AI-powered stock analysis and trading recommendations
- Real-time market data and news
- Automated trading capabilities
Pros:
- Powerful AI algorithms
- Easy to use
Cons:
- It primarily focuses on options trading
- Expensive
Pricing:
It starts from $99.97/month re-billed each month at the same time, or $959/year.
11. MetaStock
A comprehensive technical analysis software offering powerful charting, backtesting, and forecasting tools for stock, forex, and futures markets. It is a technical analysis platform that provides traders with tools to identify and analyze trends.
Features:
- Comprehensive charting and technical analysis tools
- Backtesting and forecasting tools
- Customizable workspaces
Pros:
- Extensive library of built-in indicators
- Reliable data and analytics
Cons:
- Steeper learning curve
- Pricing is high
Pricing:
MetaStock offers various pricing plans, including MetaStock D/C (Daily Charts), MetaStock EOD (End-of-Day), and MetaStock RT (Real-Time). Prices may vary depending on the plan and the data feed you choose, but they typically range from $499 to $1,695 annually.
Are AI stock trading bots profitable?
Although they have the potential to be profitable, AI trading bots do not ensure success. A trading bot’s profitability is dependent on a number of variables, such as its underlying strategy, the caliber of the data it uses, and the state of the market.
Are AI trading bots legal?
Yes, AI can trade stocks legally. But it depends on the rules in each country. Many places treat trading bots as automated systems and have rules from financial authorities. The rules are meant to keep markets fair, protect investors, and prevent cheating. AI trading software needs to follow these rules, like getting a license, reporting data, and following market rules.
Financial authorities like the SEC in the US, the FCA in the UK, and others in different countries have rules for algorithmic trading and automated systems. These rules include managing risks, testing algorithms, and watching out for market cheating.
How to Use AI for Stock Trading?
AI is being used in the trading industry in a variety of ways. One way is to order customized robots or apps that will trade for you, providing signals and making decisions based on your trading strategy. Another option is to use the many online analytical software packages and smart trading advisors that are available.


