WhatsApp is an instant messaging app owned by Meta platforms that allows users to send messages, images, voice notes, video messages, etc rapidly through this app. As of June 2023, there were approximately 2.78 billion unique active WhatsApp users globally.
WhatsApp Business app has made it easier for small businesses and start-ups to connect with potential customers, respond to queries, and provide overall enhanced customer service.
In this article, we are going to discuss top WhatsApp Statistics as of 2023 and highlight crucial stats of WhatsApp such as number of messages sent per day, WhatsApp users by country, WhatsApp penetration rate, and much more. So, let’s get started.
Whatsapp Key Statistics
As of June 2023, WhatsApp had approximately 2.78 billion unique active users worldwide.
WhatsApp is the 8th most downloaded app in the world and is ranked number 2 on the free apps section of Google Play Store.
India has the highest number of monthly active WhatsApp users globally with 535.8 million users.
Whatsapp is ranked as the most used mobile messaging app globally.
An Average Whatsapp user on an Android device spends about 38 minutes every day on the app.
53% of WhatsApp users in the United States utilize the app at least once a day.
Over 1 billion messages are sent on WhatsApp every day.
The Whatsapp app is available in over 180 countries along with 60 different languages.
6 countries have banned the usage of WhatsApp – China, the United Arab Emirates, Cuba, Iran, Syria, and North Korea.
70% of Whatsapp users check the app every day.
Distribution of Whatsapp users worldwide by gender
As of June 2023, Whatsapp had around 2.8 billion users worldwide. WhatsApp is dominated by the male audience by 52%, while the female audience who utilizes WhatsApp is 47.1%.
As of 2023, 140 billion messages are exchanged on the messaging app WhatsApp every day.
This means around 5833 million messages are exchanged every hour, 97 million messages are sent every minute, and about 1.6 million messages are sent every second.
Here is data on the number of messages exchanged on WhatsApp over the years:
Month
Number of messages exchanged
October 2011
1 billion
January 2015
30 billion
Feb 2016
42 billion
July 2017
55 billion
March 2018
65 billion
October 2020
100 billion
July 2023
140 billion
Distribution of WhatsApp Users by country
WhatsApp is available in 180 countries, out of which India has the highest number of WhatsApp users globally. Followed by Brazil in the second position with 148 million users and Indonesia in third place with 112 million users.
Country
Number of users
India
535.8 million
Brazil
148 million
Indonesia
112 million
United States
98 million
Philippines
88 million
Mexico
77 million
Russia
66.7 million
Turkey
60 million
Egypt
56 million
Pakistan
52 million
WhatsApp Statistics Monthly Active Users
As of July 2023, WhatsApp had around 2.78 billion unique active users worldwide. This popular messaging app reached the 2 billion mark back in 2020 and is expected to reach 3.14 billion by 2025. The massive spike in monthly active users came in 2020 when Whatsapp witnessed a growth of 40% in its monthly active users.
Year
Monthly Active Users
January 2014
430 million
February 2014
465 million
April 2014
500 million
August 2014
600 million
January 2015
700 million
April 2015
800 million
September 2015
900 million
February 2016
1 billion
January 2017
1.2 billion
July 2017
1.3 billion
December 2017
1.5 billion
February 2020
2 billion
July 2021
2 billion
September 2021
2.16 billion
April 2022
2.24 billion
July 2023
2.7 billion
WhatsApp penetration rate among global messaging app users as of April 2022, by country
Brazil contains the highest share of WhatsApp users with about nine in 10 messaging app users in the country. The WhatsApp Penetration Rate of Brazil is about 98.9% followed by India in the second position with 97.1% and Italy in the third rank with 97%.
Americans aged between 18 to 34 years old are most likely to engage with this popular messaging app with 31% of WhatsApp users aged between 18-34. Followed by the age group of 35 to 44 years with 27% in second place.
Here is a table showcasing WhatsApp users based on Age group:
The Standalone WhatsApp Business app was launched in January 2018. This app was built on top of WhatsApp Messenger, especially for businesses, and included numerous features such as Multimedia, Free Calls, Free international messaging, offline messages, and more.
The main motive behind this app was to help small businesses and companies connect with their clients through WhatsApp using simple steps. Let’s take a look at some of the statistics and facts related to WhatsApp Business:
More than 50 million businesses across the world utilize WhatsApp Business.
WhatsApp Business has been downloaded more than 1 billion times by users on Google Play Store.
Businesses are capable of boosting sales to 127% using WhatsApp Business.
Using WhatsApp Business can help improve customer service by 225%.
Around 175 million individuals engage with numerous businesses through WhatsApp every day.
Business Catalogs on WhatsApp are viewed by customers around 40 million times every month.
The largest market share for WhatsApp Business is in the Asia-Pacific region with an estimate of 779 million.
WhatsApp Web Statistics
WhatsApp Web allows users to conveniently send and receive messages and documents from browsers by accessing the web version of WhatsApp. This way users can effortlessly control their account on their PC. Here are some of the interesting statistics about WhatsApp Web:
WhatsApp Web has generated around 2.5 billion monthly unique visits.
From April to June 2023, there have been around 8.79 billion visits to WhatsApp Web.
The Average time a user spends on WhatsApp Web is 21 minutes and 56 seconds.
Around 50 million businesses utilize WhatsApp Web to interact with their customers, make sales, and provide support to their clients.
Brazil, India, and Mexico are the top countries that were accessing Whatsapp Web in 2023.
Wrapping Up
WhatsApp is one of the best instant messaging apps that allow users to send messages, images, videos, and audio, and etc to their friends and family rapidly. Not only is this messaging app excellent for personal use but also for professional use.
WhatsApp Business app allows companies or small businesses to connect with their customers and engage in conversations which can help enhance their sales and provide improved customer service. About 140 billion messages are exchanged on this platform every day and in the coming years, more and more users and businesses are likely to engage with this messaging app.
Twitter is the 7th most popular social media platform worldwide and positions itself at number 14 in terms of monthly active users. Rebranded as X by Elon Musk, this tool offers a wide range of features and services way beyond just social media that can be utilized by brands and businesses.
Twitter Users Spend 26% Longer Viewing Ads on Twitter which makes Twitter an excellent social media option for marketers and advertisers to promote their product using ads. In this article, we will be mentioning the latest Twitter statistics and trends as of 2023 that marketers should definitely know to run a successful campaign on Twitter.
Twitter Statistics (Top Picks)
Twitter has around 353.9 million users as of January 2023.
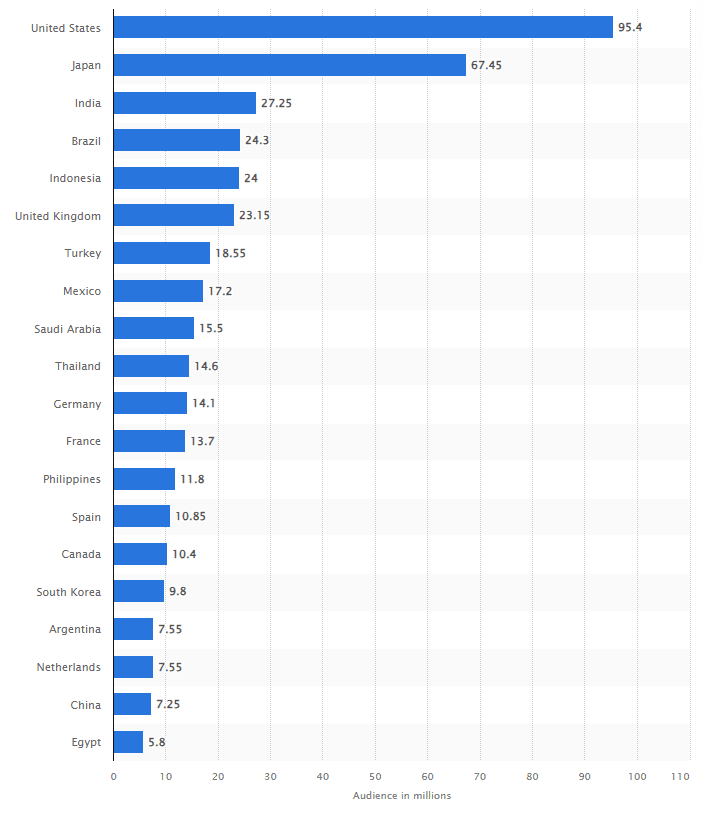
The United States is the leading country with the highest number of Twitter users 95.4 million.
Twitter is valued at $41.09 billion as of 2023.
Twitter is ranked the 14th most popular social media platform worldwide in terms of users.
Elon Musk is the most followed Twitter user with 164.2 million followers as of November 2023.
The majority of Twitter’s audience (38.5%) falls under the age bracket of 25 to 34.
The monetizable daily active users of Twitter in the United States is 41.5 million.
An Average Twitter user spends about 30.9 minutes on the platform daily.
Overview of Twitter
Launch Date
21 March, 2006
Headquarters
San Francisco, California
Founders
Jack Dorsey, Evan Williams, Biz Stone, Noah Glass
Current Owner
Elon Musk
Industry
Social Media
Number of X (formerly Twitter) users worldwide from 2019 to 2024
Twitter witnessed the highest users mark in 2022 with 368.4 million users worldwide. However, there was a decline in the total number of X (formerly Twitter) users in 2023. According to Statista, the total number of Twitter users will drop to 335.7 million by 2024.
Top countries based on the number of X (formerly Twitter) users as of January 2023
The United States is the leading country with more than 95 million X (formerly Twitter) users as of January 2023. Japan and India are ranked second and third with more than 67 million and 27 million users respectively.
Below is a table of the top 10 leading countries based on the number of Twitter users:
In 2022, Twitter boasted a revenue of $4.45 billion. Two major sources of Twitter’s revenue are its advertising services and its data licensing. In 2021, Twitter made around $4,505 million through its advertising services and around $571.79 million via data licensing.
Elon Musk shared a tweet on Twitter addressing the cash flow of Twitter remaining negative in 2023 with a nearly 50% drop in Advertising revenue along with a heavy debt load.
Below is a table showcasing the revenue of Twitter from the year 2012 to 2022:
Year
Revenue
2022
4,453 million
2021
5,077 million
2020
3,716.2 million
2019
3,458.8 million
2018
3,042.2 million
2017
2,443.1 million
2016
2,529.5 million
2015
2,217.8 million
2014
1,402.7 million
2013
664.6 million
2012
316.8 million
Essential Twitter Statistics
Let’s look at some of the most essential statistics related to Twitter that everyone should be aware of along with its popularity:
10% of Twitter users are accountable for around 92% of the Tweets shared on the platform
The majority of Twitter users aren’t active on the platform and don’t play a major part in tweeting as they are visiting the platform for content consumption rather than creation. In fact, most users on Twitter only send out one tweet every month on average. According to Pew, 10% of Twitter users are only responsible for generating 92% of tweets in the U.S.
48% of Twitter users access Twitter for the Latest news and information
According to Statista, the majority of U.S. users turn to Twitter to get news, entertainment, and various other purposes. Here is a complete breakdown of the main reasons why people use Twitter:
Twitter was bought by businessman and investor Elon Musk for $44 Billion
Elon Musk bought Twitter at a whopping amount of $44 billion on October 27, 2022. The deal was finalized after months of negotiation with Musk himself acknowledging he went out and overpaid for the platform. After taking over Twitter, Musk rebranded Twitter as “X” and introduced a new logo for the platform.
In 2020, the Penetration Rate of Twitter in the UK was 45%
There are a total of 62 million internet users in the United Kingdom, out of which around 17% of individuals were using Twitter in 2020. With a penetration rate of 45% Twitter comes under one of the most popular social media platform choices and isn’t expected to go anywhere in the coming years.
Twitter Usage Statistics
Twitter contains 396.5 Million Users across the world
Twitter has a massive audience across the world regardless of being behind other social media platforms such as Facebook and Instagram.
Various data shows that Twitter contains around 450 million active users worldwide. A recent announcement by Twitter owner Elon Musk claimed that Twitter witnesses about 259.4 million daily active users to check what others are tweeting about or what’s trending.
The United Kingdom has 19.05 Million Twitter Users
The UK alone contains a massive Twitter audience with 19.05 people having a Twitter account as of October 2021. The interesting part is that the majority of the Twitter accounts created in the UK are owned by males, making males the more dominating gender on Twitter.
500 Million Tweets are Sent Every Day
Apparently, over 500 million tweets are sent out every day, meaning around 6,000 tweets are being shared per second and 350,000 per minute. This includes various entertainment news, trending topics, daily conversations, updates, common interests, and much more.
96% of Twitter users reported using the Platform monthly in the U.S in 2020
According to Statista, 52% of the Twitter audience in the U.S. access Twitter on an everyday basis. Overall, 96% of the users responding to Twitter users claimed that they are using the platform monthly.
Twitter User and Demographics Statistics
The United States has the most Twitter users
As of January 2023, the United States was ranked as the leading country with the highest Twitter user count with 95.4 million followers. This list is followed by Japan, India, Brazil, Indonesia, and the United Kingdom.
25 to 34 Year Olds is the leading Age Group on Twitter Globally
According to Statista, twitter’s global audience was composed of 39.5% of users aged between 25 to 34 years old. Here is a complete age distribution of Twitter users across the world:
According to Statista, the majority of Twitter’s audience is male dominated with 63% of male audience and only 37% of female audience on the platform which is a massive gap.
Twitter Limit Statistics
There have been various limiting actions placed on Twitter to reduce the downtime and error pages. Let’s take a look at all the limitations that have been imposed on Twitter accounts:
Only 500 direct messages (DMs) can be sent by a Twitter account on a single day.
Users can only send 2,400 tweets in a single day. (Retweets also count as tweets)
Changes to account email: 4 per hour.
The technical follow limit is 400 in a single day.
Once a Twitter account has hit the mark of following 5,000 other accounts additional follow attempts are limited based on specific account ratios.
To ensure your brand generates a strong presence on Twitter it’s important you beat those algorithms and get your brand to reach the correct audience by investing in advertisements.
This can help users generate awareness, engagement, and conversions and help make your brand stand out and gain a good amount of attention online. Here are some of the Twitter marketing statistics that can help marketers understand the effectiveness of Twitter:
Twitter Users Spend 26% Longer Viewing Ads on Twitter
Twitter is an excellent platform for marketers to share their advertisements as people on Twitter spend around 26% of their time viewing ads. This can help marketers grab attention from numerous users online which can help increase their product sales. So, if you are wondering which social media platform to choose to promote your product then Twitter might be a great choice.
35% year-over-year increase in Global Advertisement Engagement on Twitter
One of the most important parts of Marketing metrics is Engagement for brands to keep track. This provides clear data on users’ interest, likes, and preferences in what you are sharing, while also keeping track of algorithms that your shared content is relevant to others.
Twitter witnessed a total 35% year-over-year rise in terms of global advertising engagement rate, making it more appealing for marketers and advertisers to share their content on Twitter and generate more Twitter advertisements.
Twitter is one of the best platforms for brand interaction as is often seen as more culturally relevant
Twitter is an all-in-one resource for brands and clients and it guides you through all the basics of advertising on Twitter, leads your brand toward excellent success, and helps boost your relevance. Its Agency Playbook also claims that brands that tend to spend more time and energy on advertisement are looked at as more culturally relevant and see more revenue.
Wrapping Up
Overall, X (formerly Twitter) is a great platform to gain knowledge regarding the latest news, entertainment, connecting with friends and family, and more. Regardless of witnessing a downfall in the revenue spectrum, it’s still a pretty effective platform to share your brand advertisement and gain engagement for your business.
The majority of the Twitter audience is males, which makes Twitter a good platform for marketers to advertise male-related products and services as users tend to have 26% Longer Viewing Ads on Twitter. Above we have listed down all the essential statistics related to Twitter as of 2023 that can help you understand the platform better.
Launched in 2005, Reddit has grown to be one of the most popular social media platforms on the internet. Reddit offers a wide range of individual online communities referred to as “subreddits” covering a specific topic. These subreddits have successfully attracted individuals from different regions, genders, age groups, and communities worldwide. By 2024, there were 504.54 million Reddit accounts.
In this article, we will examine Reddit statistics and gain a glimpse of its user base, age group, gender, demographics, and more.
Top Reddit User Statistics
As of 2024, there are 504.54 million users on Reddit.
63.85% of the users accessing Reddit are Males, while 36.15% are females.
The United States is the leading country with the highest proportion of Reddit users globally.
The majority of the Reddit users are young adults with 65% of the total user base aged between 18 to 34 years.
As of 2024, there are 1.2 billion monthly active users on Reddit.
The Average time spent by a new user on Reddit every day is 20 minutes.
The Average time spent by a registered user of 5 years is 35 minutes every day.
Number of Reddit users worldwide from 2019 to 2028
According to the latest reports, the number of Reddit users is projected to reach 504.54 million users in 2024 showcasing a change of 13.04 million from the previous year. Apart from this, it also suggests Reddit is expected to witness continuous growth over the years and reach a milestone of 556.59 million in 2028.
Below we have mentioned a table showcasing the number of Reddit users globally from 2019 to 2028:
It is no surprise that the majority of Reddit’s user base is young adults. Around 65% of the total Reddit user base falls under the 18- to 34-year-old age bracket. 33.04% of the user base is aged 25 to 34, while 32.74% of the users are aged between 18 and 24.
Below we have mentioned a table showcasing Reddit users by age group:
Age Group
Share of Website Users
18 to 24
32.74%
25 to 34
33.04%
35 to 44
16.07%
45 to 54
9.43%
55 to 64
5.22%
65+
3.49%
Reddit Users by Gender
Reddit is a male-dominated platform. 63.85% of the users are male, while 36.15% of females access the platform.
Gender
Share of users
Male
63.85%
Female
36.15%
Time Spent by Users on Reddit
According to a report by Reddit, newly registered users spend an average of 20 minutes on the platform every day. Meanwhile, users who have been using it for more than 5 years are likely to spend an average of 35 minutes per day on Reddit.
Reddit users who have been accessing the platform for over 7 years are likely to spend approximately 45 minutes on the platform every day.
Reddit Users by Region
The United States has recorded the highest proportion of Reddit users globally with a total traffic share of 44.17%. Followed by the United Kingdom in the second position with 10.36% of the traffic share and Canada ranked third with 5.14% of the traffic share.
Below we have mentioned a table showcasing the top 5 countries with the highest proportion of Reddit users worldwide:
As of January 2024, Reddit received around 1.22 billion visits from users globally. The numbers show a significant decrease compared to the number of visits from the previous year where Reddit received approximately 1.26 billion visits worldwide.
Below we have mentioned a table showcasing the number of users visiting Reddit worldwide from 2022 to 2024:
Reddit has witnessed significant growth in its daily active users over the years. As of Q4 2023, Reddit had 73.1 million daily active users showcasing a growth of 7 million from the previous quarter which recorded 66.0 million daily active users.
Below we have mentioned a table showcasing Reddit Daily Active users:
Year
Reddit Daily Active Users
Q1 2021
54.8 million
Q2 2021
54.0 million
Q3 2021
53.6 million
Q4 2021
53.9 million
Q1 2022
57.5 million
Q2 2022
56.5 million
Q3 2022
57.3 million
Q4 2022
57.5 million
Q1 2023
60.3 million
Q2 2023
60.4 million
Q3 2023
66.0 million
Q4 2023
73.1 million
Reddit Weekly Active Users
As of Q4 2023, Reddit recorded 267.5 million weekly active users showcasing a growth of 28 million from Q3 2023 which recorded 239 million weekly active users.
Here is a breakdown of Reddit weekly active years from 2021 to 2023:
Year
Reddit Weekly Active Users
Q1 2021
201.9 million
Q2 2021
206.2 million
Q3 2021
202.1 million
Q4 2021
200.6 million
Q1 2022
213.6 million
Q2 2022
208.6 million
Q3 2022
208.8 million
Q4 2022
207.3 million
Q1 2023
218.0 million
Q2 2023
218.1 million
Q3 2023
239.1 million
Q4 2023
267.5 million
Reddit Monthly Active Users
As of February 2024, Reddit recorded 1.2 billion Monthly Active users. Reddit witnessed its peak in January 2023, when it recorded 1.3 billion monthly active users.
Here is a breakdown of Reddit’s Monthly Active Users from 2022 to 2024:
Month, Year
Monthly Active Users
March 2022
1.1 billion
April 2022
1.1 billion
May 2022
1.1 billion
Jun 2022
1 billion
July 2022
1 billion
Aug 2022
996.6 million
Sept 2022
1 billion
Oct 2022
1.2 billion
Nov 2022
1 billion
Dec 2022
1 billion
Jan 2023
1.3 billion
Feb 2023
1.1 billion
March 2023
1.1 billion
April 2023
1.2 billion
May 2023
1.1 billion
Jun 2023
1.1 billion
July 2023
1.1 billion
Aug 2023
1 billion
Sept 2023
1.1 billion
Oct 2023
1.1 billion
Nov 2023
1.2 billion
Dec 2023
1.2 billion
Jan 2024
1.2 billion
Feb 2024
1.2 billion
Reddit Monthly Active Users growth over the years:
As of 2024, Reddit has 1.2 billion monthly active users, which is excellent growth from its previous year, which recorded 1 billion monthly active users.
Below we have mentioned a table showcasing Reddit’s Monthly Active user growth from 2018 to 2024:
Year
Reddit Monthly active users
2018
331 million
2019
430 million
2020
619 million
2021
861 million
2022
918 million
2023
1.021 billion
2024
1.212 billion
Global visits to Reddit by devices from 2022 to 2024
The desktop is clearly the preferred device type for using Reddit. As of January 2024, 5.9 billion users were accessing Reddit through their mobile, while 1.67 billion were accessing the platform through Desktop.
Below we have mentioned a detailed table showcasing the Total global visitor traffic to Reddit from 2022 to 2024 by device type:
As of May 2024, Reddit has accumulated around 2.26 billion monthly visits. The latest data also suggest that the Reddit website has a bounce rate of 43.49%. The Global search traffic of Reddit has witnessed its ups and downs in the past few years with majorly the numbers leaning towards the higher side. In April 2022, Reddit received a global search traffic of 3.84 billion, while in April 2023 it reached a search traffic of 3.49 billion. Reddit reached its peak in January 2024 when its search traffic reached 4.6 billion.
Below we have mentioned a table showcasing global Reddit search traffic over the year:
Month, Year
Global Search Traffic
April 2022
3.84 billion
May 2022
3.54 billion
June 2022
3.3 billion
July 2022
3.31 billion
August 2022
2.77 billion
September 2022
2.71 billion
October 2022
3.09 billion
November 2022
2.75 billion
December 2022
2.69 billion
January 2023
3.41 billion
February 2023
3.21 billion
March 2023
3.39 billion
April 2023
3.49 billion
May 2023
3.24 billion
June 2023
3.06 billion
July 2023
3.29 billion
August 2023
3.26 billion
September 2023
3.64 billion
October 2023
3.93 billion
November 2023
4.03 billion
December 2023
4.34 billion
January 2024
4.6 billion
Annual revenue generated by Reddit
In 2023, the popular social media platform Reddit generated an annual revenue of 804.03 million U.S. dollars. It showcased an increase of 20.6% in its annual revenue compared to 2022 which recorded 666.7 million U.S. dollars.
Surprisingly, Organic search is the most popular marketing channel that has contributed to generating the maximum amount of traffic on Reddit by 59.84%. Followed by Direct, as the second most popular medium generated 37.56% of the traffic on Reddit.
Below we have mentioned a table showcasing the top marketing channels of Reddit:
As mentioned above, organic search is the leading marketing channel that helps generate 58.84% of the traffic on Reddit. However, the top organic search term is “Reddit” which generated around 0.61% of the traffic.
Below we have mentioned the top organic search terms that help generate traffic on Reddit:
Top organic search terms
Traffic generated
reddit
0.61%
lol reddit
0.2%
redit
0.2%
livestreamfails
0.2%
reddit soccer
0.01%
Top Social Networks that generate traffic to Reddit
YouTube is the leading social media platform that generates approximately 56.81% of the traffic on Reddit. Followed by X (Twitter) in the second position which generated around 16.90% traffic on Reddit.
Below we have mentioned a table showcasing the top social networks that drove traffic to Reddit:
Top Social Network
Traffic generated
YouTube
56.81%
X (Twitter)
16.90%
Facebook
10.28%
Instagram
2.43%
Discord
2.12%
Other
11.45%
Number of Posts shared on Reddit from 2018 to 2024
There is a continuous growth in the number of posts shared on Reddit over the years. As of 2024, there are 550 million posts shared on Reddit showcasing a growth of 81 million from its previous year.
Below we have mentioned a table showcasing the total number of posts shared on Reddit from 2018 to 2024:
Year
Number of posts shared
2018
153 million
2019
199 million
2020
303 million
2021
366 million
2022
422 million
2023
469 million
2024
550 million
Most Popular Subreddits
Currently, there are more than 100,000 active subreddits on Reddit, and over 500 of them have 1 million subscribers. The subreddit with the highest number of subscribers is “r/funny,” which contains 56.6 million subscribers. It is followed by “r/AskReddit,” the second-most popular subreddit, with 45 million subscribers.
Here is a breakdown of the top 20 most popular subreddits:
A survey was conducted in the United States among Reddit users to understand the top reasons behind American users accessing Reddit. According to the survey, 72% of the respondents claimed entertainment as their top reason behind accessing Reddit. While getting news is the second most common reason 43%. Some of the other common reasons include following brands and companies, creating professional networks, and keeping in touch with close ones.
Reddit Mobile app usage witnessed a significant decrease in its downloads as Reddit Mobile apps were installed approximately 34 million times by users across Google Play Store and App Store in 2023 cutting down from 54 million downloads in 2022. Talking about the usage of the Reddit app, only 7% of the users opened the app on a daily basis during the fourth quarter of 2023. Other social media platforms such as Instagram (43%), Snapchat (25%), TikTok (32%) X/Twitter (18%), etc have a higher share of daily app usage among the users compared to Reddit.
Top Activity of Reddit Users on the app
More than half (52%) of Reddit users in the U.S. utilize the app to access the posts, with accessing the main Reddit feed being the second most popular activity by 26%.
Below we have mentioned a table showcasing the time spent by Reddit users on the app:
Activity
Share of users
Post detail pages (Reddit posts)
52%
Main Reddit feed
26%
Video feed, profile, chat and search
15%
Subreddits
7%
FAQs
What are the demographics of Reddit users by age?
The majority of Reddit users are 25 to 34 years old, making up 33.04% of its total user base.
Is Reddit popular in 2024?
Yes, despite tough competition in terms of social media platforms, Reddit will remain popular in 2024, with an estimated 1.2 billion monthly unique visitors.
How many active subreddits are there?
There are currently more than 100,000 active subreddits available on the platform, 500 of which have 1 million subscribers.
How many users are on Reddit in 2024?
As of 2024, there are 504.54 million users on Reddit showcasing a change of approximately 13.04 million from its previous year.
Which country uses Reddit most?
The United States uses Reddit the most, with a proportion of 44.17% of the total Reddit users worldwide. Followed by, the United Kingdom in the second position with 10.36% of the total proportion of Reddit.
What is Reddit mostly used for?
72% of Reddit users use it mostly for entertainment purposes, followed by receiving news as the second most popular reason behind using the platform 43%.
What is the gender breakdown of Reddit users?
Reddit is primarily a male-dominated platform. 63.85% of the total users are males, while 36.15% are females.
What is the most popular subreddit in 2024?
The most popular subreddit in 2024 is “r/funny” with 56.6 million subscribers. Followed by, r/AskReddit in the second position with 45 million subscribers.
Wrapping Up
Despite popular social media platforms (Instagram and Facebook) existing at this time, Reddit has still managed to grow continuously over the years. Reddit stands strong as a unique online platform that runs on the power of its user base. With over 100,000 active subreddits available, Reddit caters to the requirements of people with different thoughts, interests, and preferences globally allowing users to connect with like-minded people.
TikTok is one of the most widespread social media platforms worldwide that has created a dominance for itself in the short-form video format. With billions of TikTok users available in 2024, the platform offers a wide range of short-form videos in numerous categories such as dance videos, funny videos, cooking tutorials, sports, art, and much more. But how much time do people actually spend on TikTok? In this article, we are going to explore data regarding the average time spent on TikTok and uncover daily and monthly usage of TikTok among the users.
Top Average Time Spent on TikTok
In 2024, a user spends 58 minutes and 24 seconds on average accessing TikTok.
The Average time spent by a user on TikTok per week is 6.06 hours.
22% of American children and teenagers spend 2 to 3 hours accessing TikTok.
32% of the users spend their time accessing TikTok.
The Average time spent by a user on TikTok on a monthly basis is 34 hours.
Gen Z users spend the most time accessing TikTok.
How Much Time Do People Spend On TikTok?
The total time spent by a user on TikTok can vary depending on the person. In 2024, the average time spent by people on TikTok ranges from 55.8 minutes to 61 minutes on a daily basis.
Average Time Spent on TikTok from 2019 to 2024
There has been a continuous growth in the average time spent on TikTok from 2019 to 2024. Back in 2019, the average daily time spent by users on TikTok was 27 minutes and 24 seconds, this number grew to 38 minutes and 36 seconds in 2020 showcasing a growth of 11 minutes and 12 seconds.
Further, the average daily time spent on TikTok reached 45 minutes and 18 seconds in 2021 and 52 minutes in 2022. A growth of 3 minutes and 48 seconds was witnessed the next year when the average reached 55 minutes and 48 seconds. As of 2024, the average time spent is 58 minutes and 28 seconds on TikTok.
Year
Average Daily Time Spent on TikTok
Change Over Previous Year
2019
27 minutes, 24 seconds
–
2020
38 minutes, 36 seconds
? 11 minutes, 12 seconds
2021
45 minutes, 18 seconds
? 6 minutes, 42 seconds
2022
52 minutes
? 6 minutes, 42 seconds
2023
55 minutes, 48 seconds
? 3 minutes, 48 seconds
2024
58 minutes, 24 seconds
? 3 minutes, 36 seconds
Monthly time spent on TikTok per user, by Region
In 2023, the approximate time spent by users on TikTok worldwide is 34 hours per month. Users in the United Kingdom spend around 49 hours on average using TikTok, while users in the United States spend an average of 45 hours accessing the platform per month.
Below we have mentioned a table showcasing the average time spent on TikTok per user on a monthly basis by Region:
Average Time Spent by Children and Teenagers on TikTok
TikTok is a popular social media platform worldwide and it is utilized by children and teenagers on a large scale. Reports suggest that 1 in 4 (22%) of American teenagers spend 2 to 3 hours a day on average accessing TikTok. While 65% of the U.S. Teens spend at least 1 hour accessing the platform.
Below we have mentioned a table showcasing the average daily time spent by the U.S. Teens on TikTok:
Average Daily Time Spent on TikTok
Proportion of US Teens
0 to 15 mins
22%
15 to 30 mins
5%
30 to 60 mins
10%
1 to 2 hours
20%
2 to 3 hours
22%
3 to 4 hours
10%
4 to 5 hours
5%
5+ hours
8%
On average, an American child spends around 1 hour and 53 minutes accessing TikTok on average per day. This is the highest time spent by children accessing a social media platform, in fact, children spend 23 minutes more than the average time spent on Snapchat.
To provide a better insight into the average time spent by children on social media platforms, we have mentioned a table below comparing the time spent on social media platforms by U.S. children and UK children.
Social Media Platform
Average Daily Time Spent by US Children
Average Daily Time Spent by UK Children
TikTok
1 hour and 53 minutes
1 hour and 54 minutes
Snapchat
1 hour and 30 minutes
1 hour and 31 minutes
Pinterest
20 mins
30 mins
Facebook
18 mins
14 mins
Reddit
13 mins
11 mins
Twitter
10 mins
9 mins
A user spends 6.06 hours on TikTok on average per week
On average the time spent by a user accessing TikTok can vary from a few minutes to hours. The average time spent by a user on TikTok on a weekly basis is 6.06 hours. TikTok contains a wide range of video content available ranging from dance videos to funny videos to cooking tutorials and much more, which often keeps people hooked on the TikTok app by capturing their interests and likes.
Here are the most popular reasons behind why people utilize TikTok according to a global web index study that took place in 2020:
Entertainment
Inspiration
Self-expression and promotion
Trend updates
Social
Apparently, entertainment is the top reason behind TikTok users accessing the platform. People often look for fun and entertaining videos online during their spare time to relieve stress and have a good laugh as it can help lighten their mood and make them feel refreshed.
Around 167 million videos are being watched by users on TikTok every minute
TikTok is highly utilized by people across the world and users open the app almost 9 times a day, which boosts its user traffic and the number of videos that are being watched on a daily basis. Thanks to TikTok’s targeted nature via algorithms, users often find content that is relatable and linked to their users’ interests. Algorithms usually recommend videos by analyzing your liked posts, comments, saved content and accounts you follow. Often algorithms are also linked towards the kind of videos a user interacts with. This results in users spending more and more time scrolling through TikTok on their mobile devices.
Average Time Spent Using TikTok compared to other social media platforms
TikTok is the leading social media platform with the highest share of American users (32%) spending time on the platform. Facebook and Instagram are the second leading social media platforms with the highest time spent among the users by 20%.
Below we have mentioned a table showcasing the average time spent by users on different social media platforms:
Social Media Platform
Share of Time Spent Among US TikTok Users
TikTok
32%
Facebook
20%
Instagram
20%
YouTube
15%
Snapchat
9%
Twitter
2%
Reddit
2%
Pinterest
2%
FAQs
What is the average watch time per video on TikTok?
The Average watch time per video on TikTok is 3.33 seconds, while the average watch time per person was recorded at 5.26 seconds.
How much time does Gen Z spend on TikTok?
Gen Z spends around 1 hour and 16 minutes accessing the TikTok app. Majority of the Gen Z users consider TikTok as their most preferred social media platform.
Which country uses TikTok the most?
The United States is the leading country that uses TikTok the most. It has around 148 million TikTok users.
What is the perfect duration for a TikTok video?
The perfect duration for a TikTok video is anywhere between 21 seconds to 34 seconds. However, your TikTok video must be a minimum of 10 seconds long.
Why is TikTok so addictive?
TikTok offers a wide range of engaging video content that can keep the user hooked to the platform and make them want to constantly keep on scrolling causing addiction. Its algorithm analyzes your likes, comments, accounts you follow, and other data to understand your content preferences for better recommendations online.
Wrapping Up
Overall, the average time spent by users on TikTok has witnessed constant growth in the past few years. From an average of 27 minutes, and 24 seconds in 2019, it reached a whopping 58 minutes, and 24 seconds in 2024. The addictive content on TikTok often keeps people glued towards their mobile screen which results in users spending hours simply scrolling through TikTok. Based on the current statistics, the time spent on TikTok is expected to witness growth in the future as well thanks to excellent demand among people globally.
Threads is an online social media platform operated by Meta Platforms that allows users to share their posts, reposts, likes, images, videos, and more. Threads was launched in July 2023 and gained 1 million sign-ups within the 1st hour of launch.
It even surpassed ChatGPT in becoming the fastest platform to reach 100 million sign-ups in just 5 days. In this article, we are going to take a look at the Threads app Statistics as of 2023 and talk about its Daily Active users, Forecast revenue, Usage Rate, and much more. So, let’s get started.
Threads Key Statistics as of 2023
Threads crossed 100 million sign-ups within 5 days of its launch, surpassing ChatGPT in becoming the fastest platform to reach 100 million sign-ups.
More than 95 million posts were published on Threads in its first 24 hours.
An Average thread app user spends around 3 minutes on the platform.
Threads allow users to write up to 500 characters in a post or comment.
Users can upload a video up to 5 minutes in length on the Threads app.
Threads app is available in 100 countries, none of which includes the European Union.
Threads Overview
Launch Date
July 5, 2023
Owner
Meta Platforms
Type of site
Social networking platform
Languages Available
31 languages
Areas Served
100 countries
Threads crossed 5 million sign-ups within the first four hours of its launch.
Threads gained massive sign-ups within a few hours of its launch, in its first hour Threads gained 1 million subscribers and in just 5 Days the sign-ups crossed 100 million showcasing the astonishing demand of the platform among the audience.
Here is a table demonstrating Threads accumulation of users after its launch:
Threads is ranked as the fastest application to reach both the 1 million and 100 million user mark in history
Threads received excellent response from the audience and broke the record of the fastest-growing consumer app in internet history, which was previously obtained by OpenAI’s chatbot “ChatGPT.” Threads was able to gain 1 million sign-ups in just one hour and was able to reach the astonishing mark of 100 million sign-ups in five days, which was achieved by ChatGPT in 2 months.
Threads Forecast Revenue
According to a new forecast, Meta’s Threads app released in July 2023, is likely to generate around $8 billion in annual revenue and is expected to reach about 11.3 billion by the end of 2026.
Year
Forecast Revenue (in billions)
2023
0.8 billion
2024
4.5 billion
2025
8 billion
2026
11.3 billion
You can use 500 Characters in a Thread Post or comment
The Thread platform allows users to use up to 500 characters in a post or comment. Users can also upload links, images, and videos up to 5 minutes in length. Regardless of Threads appearing quite similar to the popular tweeting app Twitter/X, this platform allows users to post with twice as long characters as Twitter/X. Since Twitter only allows users to post up to 280 characters of posts with threads you can post up to 500 characters effortlessly and even add up to 10 images in a post.
Threads introduced a web version after 8 weeks of its Mobile-Only launch
Threads was first introduced as a mobile-only app in July 2023 imitating the parent app Instagram. Users need to download the official app of Threads through the Play Store or App Store on their device to access the platform.
However, eight weeks after the release of Threads Mark Zuckerberg announced they were introducing a new web version of Threads. This announcement came on August 22, and now users can easily access Threads through the web by visiting https://www.threads.net/login and interacting with people through their PCs.
Average Threads users spend around 3 minutes on the app
According to Similarweb, the average amount of time spent by daily active users was initially 14 minutes globally during its launch along with the US having a significantly higher duration of about 21 minutes. However, after a month of its release, the figure subsequently dropped to 3 minutes.
Threads witnessed a drop of 85% in Usage rate after a Month
Threads witnessed a massive rise in its sign-ups quickly after the app was launched in July 2023 with users across the world downloading the app and crossing 100 million sign-ups in just 5 Days. However, the usage count of the threads app instantly dropped just a month after its launch according to Similarweb.
The Android app Threads witnessed a peak at 49.3 million Daily active users globally on 7th July. However, after a month on August 7th, the app witnessed a massive drop in daily active users as the count went from 49.3 million to 10.3 million. In the United States threads app had 2.3 million Daily active users by 7th July. However, by the 7th of August, the Daily active user count was 576,000.
Threads App held the Top spot in the App Store and Play Store for a short duration
Within a short duration after Threads launch, the app held the top spot in Google’s Play Store and Apple’s App Store. However, after a few days on July 10, 2023, the spot was overtaken by another highflyer, Remini holding the top spot on the Apple App store in the U.S.
India is the leading country with the highest number of Threads Downloads
According to Data.ai, India has the highest download rate in Threads worldwide with about 33% share of downloads. Brazil holds the second position in the highest Threads download rate with 22% of downloads followed by the United States with a 16% download rate. Mexico is the fourth country in this list with 8% of the highest threads downloads while Japan holds about 5% of Threads downloads.
There are a total of 8 million Daily Active Users in Threads
Regardless of Threads gaining an impressive amount of sign-ups in just a few months of its launch, the Daily Active users ratio isn’t as high as expected. According to the latest data, the daily active users list in July 2023 was only 8 million despite Threads having 100 million sign-ups in just 5 days. This is a major drop from its peak daily active user count which was 44 million reported on 7th July, 2023.
Threads Demographics – Gender
A large part of Threads is dominated by Males 68%, while only 32% of females are accessing the thread app according to a report by searchlogistic.
Here is a table showcasing the distribution of Threads users based on the Gender:
Gender
Percentage of users
Male
68%
Female
32%
Distribution of Age Group in Threads
The largest age group of users in Threads belongs to the audience aged between 15 to 23 years with 28%. While 11% of males and about 5% of females belong to the age group of 18 to 25 years. It was also reported that only 2% of females and 3% of males aged 45 years and older are accessing Threads.
Wrapping Up
Threads is still a relatively new app considering it was launched a few months back in July 2023 hence it’s difficult to generate statistics about the app. However, there is no doubt that threads witnessed an impressive amount of sign-ups during its launch and even surpassed popular chatbot ChatGPT in becoming the fastest platform gaining 100 million sign-ups in just 5 days.
Regardless of a steady start, there has been a drop when it comes to Daily active users, downloads, and much more which has dropped the popularity threads gained during its launch. As of now, Meta is working towards improving its features and taking in the best ideas to improve the stats of Threads and become more appealing than Twitter lite.
The end of Big Data? Based on his discussions with CIOs, reports Derrick Harris at GigaOm, Opera Solutions’ CEO Arnab Gupta “thinks the analytics market will crest around the end of next year as CIOs face enormous data spikes.” Is this what he means by “turning Big Data into Small Data?” Apparently saying “crest” is a very convincing way to get $84 million, but does he really believe that the Big Data flood is going to start tapering off next year?
EMC released today the 5th annual Digital Universe study from IDC. So now we have five years’ worth of estimating, with a consistent methodology, the amount of data created and copied annually in the world. It turns out that the amount of digital data created each year has grown by a factor of 9 in the last five years. And since IDC uses the same methodology to forecast the next five years, it looks like data will grow by a factor of 61 over the ten-year period, 2005 t0 2015. Continue reading →
In February 2015, Cisco released the Cisco VNI Global Mobile Data Traffic Forecast, 2014 – 2019. Global highlights from the updated study include the following projections:
By 2019:
There will be 5.2 billion global mobile users, up from 4.3 billion in 2014
There will be 11.5 billion mobile-ready devices and connections, more than 4 billion more than there were in 2014
The average mobile connection speed will increase 2.4-fold, from 1.7 Mbps in 2014 to 4.0 Mbps by 2019
Global mobile IP traffic will reach an annual run rate of 292 exabytes, up from 30 exabytes in 2014