Social media these days is full of 1990s high school pictures. Do you wonder how people are posting their high school pictures that look old, in 2023?
These pictures are the result of artificial intelligence as there is an app called EPIK that generates your AI yearbook. In this article, we are covering all the aspects of the AI yearbook and the alternative to the EPIK app. Read the article further to know more about the AI yearbook trend.
What is the trending AI yearbook app?
The AI yearbook is trending among all social media users as it generates your picture using AI as to how you look if you were in a high school during the 1990s. The AI generates it in the same way as that of a high school yearbook.
You can also try this amazing trend with the AI Yearbook app which is known as EPIK. The app is available on the Play Store as well as the App Store. Many celebrities from around the world are participating in this trend and are uploading their pictures on their social media handles including Instagram and TikTok.
How to do viral AI yearbook photo trend?
You can do the viral yearbook AI photo trend using an app called EPIK. The app is available on the Google Play Store as well as the App Store.
You have to upload 8-12 selfies and the app will generate your AI yearbook using artificial intelligence. You can also choose the trending stereotypes at that time whether it is that of a cheerleader or a basketball player you have many options to choose from.
How to create AI yearbook pictures with the viral EPIK app?
Generating your AI yearbook with the viral EPIK app is not a difficult task if you follow the steps given below.
Step 1: Firstly, you have to go to your app store if you are an iOS user whereas the Android users can open the Google Play Store.
Step 2: Search for the ‘EPIK’ app on the app store and download it, the app is available for free.
Step 3: As soon as you are done with the download, the system will install the app on your device automatically.
Step 4: Now open the app and find the ‘Try AI yearbook’ option in it.
Step 5: You have to upload 8-12 selfies from different angles and select gender.
Step 6: Finally, select the delivery option as per your needs and the app will provide you 60 pictures within the time frame.
Is the AI yearbook free? How much does yearbook AI cost?
The AI yearbook is available on the EPIK app which is available to download from the Google Play Store and App Store for free.
Although the app is available for free, the AI yearbook feature requires you to subscribe to one of the delivery plans. The plans differ in the time taken for AI yearbook generation. The developers offer you the following plans:-
1. Standard Delivery
In this plan, you can get your AI yearbook pictures within 24 hours. You can opt for this option if you don’t have an urgent requirement for the yearbook. The app charges you $5.99 for this plan. Unfortunately, at this point, the standard delivery option is not available.
2. Express Delivery
The express delivery plan is for excited users and celebrities as it provides you the output within 2 hours of the payment. For express delivery, the app charges $9.99 for every user.
Is the AI yearbook safe?
Safety is a major concern for AI headshot apps like these as it involves the pictures of the user which can be a direct breach of their privacy. There were allegations against the developers that they were storing the data to enhance the working of AI.
But, in a recent press conference, the app developers revealed that the pictures do not remain on the server and are removed after delivery. Therefore, we can say that the EPIK app ensures that your AI yearbook is safe and there is no threat to your privacy.
How to make the AI Yearbook for free?
The AI Yearbook trend was originally a brainchild of the EPIK app but the app generates the yearbook through in-app purchases. You don’t need to worry as we have an alternative to the EPIK app. The Reface app also allows users to generate the AI yearbook of the 1990s.
The app is available for free on the Google Play Store and the App Store. Reface does not charge any fees for generating the Yearbook, unlike EPIK. Apart from EPIK and Reface, various other apps provide the same service.
Conclusion
The AI yearbook is a great option to relive the days of the 1990s which is practically impossible but thanks to artificial intelligence using which we can generate our 1990s look. The majority of the users prefer EPIK over any other app to generate their pictures but the unavailability of the standard delivery option is making people look for other options.
We hope after reading the article you can generate your AI Yearbook and participate in the AI yearbook trend.
WhatsApp is an instant messaging app owned by Meta platforms that allows users to send messages, images, voice notes, video messages, etc rapidly through this app. As of June 2023, there were approximately 2.78 billion unique active WhatsApp users globally.
WhatsApp Business app has made it easier for small businesses and start-ups to connect with potential customers, respond to queries, and provide overall enhanced customer service.
In this article, we are going to discuss top WhatsApp Statistics as of 2023 and highlight crucial stats of WhatsApp such as number of messages sent per day, WhatsApp users by country, WhatsApp penetration rate, and much more. So, let’s get started.
Whatsapp Key Statistics
As of June 2023, WhatsApp had approximately 2.78 billion unique active users worldwide.
WhatsApp is the 8th most downloaded app in the world and is ranked number 2 on the free apps section of Google Play Store.
India has the highest number of monthly active WhatsApp users globally with 535.8 million users.
Whatsapp is ranked as the most used mobile messaging app globally.
An Average Whatsapp user on an Android device spends about 38 minutes every day on the app.
53% of WhatsApp users in the United States utilize the app at least once a day.
Over 1 billion messages are sent on WhatsApp every day.
The Whatsapp app is available in over 180 countries along with 60 different languages.
6 countries have banned the usage of WhatsApp – China, the United Arab Emirates, Cuba, Iran, Syria, and North Korea.
70% of Whatsapp users check the app every day.
Distribution of Whatsapp users worldwide by gender
As of June 2023, Whatsapp had around 2.8 billion users worldwide. WhatsApp is dominated by the male audience by 52%, while the female audience who utilizes WhatsApp is 47.1%.
As of 2023, 140 billion messages are exchanged on the messaging app WhatsApp every day.
This means around 5833 million messages are exchanged every hour, 97 million messages are sent every minute, and about 1.6 million messages are sent every second.
Here is data on the number of messages exchanged on WhatsApp over the years:
Month
Number of messages exchanged
October 2011
1 billion
January 2015
30 billion
Feb 2016
42 billion
July 2017
55 billion
March 2018
65 billion
October 2020
100 billion
July 2023
140 billion
Distribution of WhatsApp Users by country
WhatsApp is available in 180 countries, out of which India has the highest number of WhatsApp users globally. Followed by Brazil in the second position with 148 million users and Indonesia in third place with 112 million users.
Country
Number of users
India
535.8 million
Brazil
148 million
Indonesia
112 million
United States
98 million
Philippines
88 million
Mexico
77 million
Russia
66.7 million
Turkey
60 million
Egypt
56 million
Pakistan
52 million
WhatsApp Statistics Monthly Active Users
As of July 2023, WhatsApp had around 2.78 billion unique active users worldwide. This popular messaging app reached the 2 billion mark back in 2020 and is expected to reach 3.14 billion by 2025. The massive spike in monthly active users came in 2020 when Whatsapp witnessed a growth of 40% in its monthly active users.
Year
Monthly Active Users
January 2014
430 million
February 2014
465 million
April 2014
500 million
August 2014
600 million
January 2015
700 million
April 2015
800 million
September 2015
900 million
February 2016
1 billion
January 2017
1.2 billion
July 2017
1.3 billion
December 2017
1.5 billion
February 2020
2 billion
July 2021
2 billion
September 2021
2.16 billion
April 2022
2.24 billion
July 2023
2.7 billion
WhatsApp penetration rate among global messaging app users as of April 2022, by country
Brazil contains the highest share of WhatsApp users with about nine in 10 messaging app users in the country. The WhatsApp Penetration Rate of Brazil is about 98.9% followed by India in the second position with 97.1% and Italy in the third rank with 97%.
Americans aged between 18 to 34 years old are most likely to engage with this popular messaging app with 31% of WhatsApp users aged between 18-34. Followed by the age group of 35 to 44 years with 27% in second place.
Here is a table showcasing WhatsApp users based on Age group:
The Standalone WhatsApp Business app was launched in January 2018. This app was built on top of WhatsApp Messenger, especially for businesses, and included numerous features such as Multimedia, Free Calls, Free international messaging, offline messages, and more.
The main motive behind this app was to help small businesses and companies connect with their clients through WhatsApp using simple steps. Let’s take a look at some of the statistics and facts related to WhatsApp Business:
More than 50 million businesses across the world utilize WhatsApp Business.
WhatsApp Business has been downloaded more than 1 billion times by users on Google Play Store.
Businesses are capable of boosting sales to 127% using WhatsApp Business.
Using WhatsApp Business can help improve customer service by 225%.
Around 175 million individuals engage with numerous businesses through WhatsApp every day.
Business Catalogs on WhatsApp are viewed by customers around 40 million times every month.
The largest market share for WhatsApp Business is in the Asia-Pacific region with an estimate of 779 million.
WhatsApp Web Statistics
WhatsApp Web allows users to conveniently send and receive messages and documents from browsers by accessing the web version of WhatsApp. This way users can effortlessly control their account on their PC. Here are some of the interesting statistics about WhatsApp Web:
WhatsApp Web has generated around 2.5 billion monthly unique visits.
From April to June 2023, there have been around 8.79 billion visits to WhatsApp Web.
The Average time a user spends on WhatsApp Web is 21 minutes and 56 seconds.
Around 50 million businesses utilize WhatsApp Web to interact with their customers, make sales, and provide support to their clients.
Brazil, India, and Mexico are the top countries that were accessing Whatsapp Web in 2023.
Wrapping Up
WhatsApp is one of the best instant messaging apps that allow users to send messages, images, videos, and audio, and etc to their friends and family rapidly. Not only is this messaging app excellent for personal use but also for professional use.
WhatsApp Business app allows companies or small businesses to connect with their customers and engage in conversations which can help enhance their sales and provide improved customer service. About 140 billion messages are exchanged on this platform every day and in the coming years, more and more users and businesses are likely to engage with this messaging app.
Threads is an online social media platform operated by Meta Platforms that allows users to share their posts, reposts, likes, images, videos, and more. Threads was launched in July 2023 and gained 1 million sign-ups within the 1st hour of launch.
It even surpassed ChatGPT in becoming the fastest platform to reach 100 million sign-ups in just 5 days. In this article, we are going to take a look at the Threads app Statistics as of 2023 and talk about its Daily Active users, Forecast revenue, Usage Rate, and much more. So, let’s get started.
Threads Key Statistics as of 2023
Threads crossed 100 million sign-ups within 5 days of its launch, surpassing ChatGPT in becoming the fastest platform to reach 100 million sign-ups.
More than 95 million posts were published on Threads in its first 24 hours.
An Average thread app user spends around 3 minutes on the platform.
Threads allow users to write up to 500 characters in a post or comment.
Users can upload a video up to 5 minutes in length on the Threads app.
Threads app is available in 100 countries, none of which includes the European Union.
Threads Overview
Launch Date
July 5, 2023
Owner
Meta Platforms
Type of site
Social networking platform
Languages Available
31 languages
Areas Served
100 countries
Threads crossed 5 million sign-ups within the first four hours of its launch.
Threads gained massive sign-ups within a few hours of its launch, in its first hour Threads gained 1 million subscribers and in just 5 Days the sign-ups crossed 100 million showcasing the astonishing demand of the platform among the audience.
Here is a table demonstrating Threads accumulation of users after its launch:
Threads is ranked as the fastest application to reach both the 1 million and 100 million user mark in history
Threads received excellent response from the audience and broke the record of the fastest-growing consumer app in internet history, which was previously obtained by OpenAI’s chatbot “ChatGPT.” Threads was able to gain 1 million sign-ups in just one hour and was able to reach the astonishing mark of 100 million sign-ups in five days, which was achieved by ChatGPT in 2 months.
Threads Forecast Revenue
According to a new forecast, Meta’s Threads app released in July 2023, is likely to generate around $8 billion in annual revenue and is expected to reach about 11.3 billion by the end of 2026.
Year
Forecast Revenue (in billions)
2023
0.8 billion
2024
4.5 billion
2025
8 billion
2026
11.3 billion
You can use 500 Characters in a Thread Post or comment
The Thread platform allows users to use up to 500 characters in a post or comment. Users can also upload links, images, and videos up to 5 minutes in length. Regardless of Threads appearing quite similar to the popular tweeting app Twitter/X, this platform allows users to post with twice as long characters as Twitter/X. Since Twitter only allows users to post up to 280 characters of posts with threads you can post up to 500 characters effortlessly and even add up to 10 images in a post.
Threads introduced a web version after 8 weeks of its Mobile-Only launch
Threads was first introduced as a mobile-only app in July 2023 imitating the parent app Instagram. Users need to download the official app of Threads through the Play Store or App Store on their device to access the platform.
However, eight weeks after the release of Threads Mark Zuckerberg announced they were introducing a new web version of Threads. This announcement came on August 22, and now users can easily access Threads through the web by visiting https://www.threads.net/login and interacting with people through their PCs.
Average Threads users spend around 3 minutes on the app
According to Similarweb, the average amount of time spent by daily active users was initially 14 minutes globally during its launch along with the US having a significantly higher duration of about 21 minutes. However, after a month of its release, the figure subsequently dropped to 3 minutes.
Threads witnessed a drop of 85% in Usage rate after a Month
Threads witnessed a massive rise in its sign-ups quickly after the app was launched in July 2023 with users across the world downloading the app and crossing 100 million sign-ups in just 5 Days. However, the usage count of the threads app instantly dropped just a month after its launch according to Similarweb.
The Android app Threads witnessed a peak at 49.3 million Daily active users globally on 7th July. However, after a month on August 7th, the app witnessed a massive drop in daily active users as the count went from 49.3 million to 10.3 million. In the United States threads app had 2.3 million Daily active users by 7th July. However, by the 7th of August, the Daily active user count was 576,000.
Threads App held the Top spot in the App Store and Play Store for a short duration
Within a short duration after Threads launch, the app held the top spot in Google’s Play Store and Apple’s App Store. However, after a few days on July 10, 2023, the spot was overtaken by another highflyer, Remini holding the top spot on the Apple App store in the U.S.
India is the leading country with the highest number of Threads Downloads
According to Data.ai, India has the highest download rate in Threads worldwide with about 33% share of downloads. Brazil holds the second position in the highest Threads download rate with 22% of downloads followed by the United States with a 16% download rate. Mexico is the fourth country in this list with 8% of the highest threads downloads while Japan holds about 5% of Threads downloads.
There are a total of 8 million Daily Active Users in Threads
Regardless of Threads gaining an impressive amount of sign-ups in just a few months of its launch, the Daily Active users ratio isn’t as high as expected. According to the latest data, the daily active users list in July 2023 was only 8 million despite Threads having 100 million sign-ups in just 5 days. This is a major drop from its peak daily active user count which was 44 million reported on 7th July, 2023.
Threads Demographics – Gender
A large part of Threads is dominated by Males 68%, while only 32% of females are accessing the thread app according to a report by searchlogistic.
Here is a table showcasing the distribution of Threads users based on the Gender:
Gender
Percentage of users
Male
68%
Female
32%
Distribution of Age Group in Threads
The largest age group of users in Threads belongs to the audience aged between 15 to 23 years with 28%. While 11% of males and about 5% of females belong to the age group of 18 to 25 years. It was also reported that only 2% of females and 3% of males aged 45 years and older are accessing Threads.
Wrapping Up
Threads is still a relatively new app considering it was launched a few months back in July 2023 hence it’s difficult to generate statistics about the app. However, there is no doubt that threads witnessed an impressive amount of sign-ups during its launch and even surpassed popular chatbot ChatGPT in becoming the fastest platform gaining 100 million sign-ups in just 5 days.
Regardless of a steady start, there has been a drop when it comes to Daily active users, downloads, and much more which has dropped the popularity threads gained during its launch. As of now, Meta is working towards improving its features and taking in the best ideas to improve the stats of Threads and become more appealing than Twitter lite.
Spotify is considered one of the biggest music streaming platforms with 574 million monthly active users worldwide. Users need to simply register their account on Spotify and you can start listening to your favorite songs, podcasts, and various other audio content for free or through an ad-free premium plan.
In 2022, Spotify generated a revenue of €11.72 billion which witnessed a 21% increase year-on-year. Spotify’s premium subscription has played a primary role in generating 11.7 billion euros in revenue compared to the ad placements.
In this article, we are going to take an in-depth look at Spotify Statistics as of 2023 including its overview, number of premium subscribers, revenue, and much more. So, let’s begin.
Spotify Key Statistics
Spotify is accessible in over 183 Countries worldwide. By 2020, its reach expanded to 80+ additional countries and is expected to keep expanding in the coming years.
Spotify contains around 5 million podcast titles in its library.
56% of Spotify’s user base in the United States are Females, while the user base for males is 44%.
Spotify had collected around 100 million songs by 2023.
Spotify’s iOS app is available in 157 countries.
In 2022, there were more than 456 million monthly active users on Spotify.
Spotify earned around $1 billion through ads alone in 2021.
Europe has around 141 million active monthly users on Spotify, out of which 76 million are premium subscribers.
Around 10 MB to 150 MB of data is consumed by Spotify every hour.
There are around 4 million songs on Spotify that have never been played or have zero streams.
Spotify Overview
Founded
23 April 2006
Headquarters
Stockholm, Sweden
Founders
Daniel EkMartin Lorentzon
Industry
Audio streaming and Podcasting
Type of business
Public
Number of Spotify monthly active users (MAUs) worldwide
The third quarter of 2023, witnessed the highest monthly active users worldwide at 574 million. Spotify witnessed a growth of more than 118 million users in just a year.
Year
Spotify monthly active users (MAUs)
Q1 2015
68 million
Q2 2015
77 million
Q3 2015
82 million
Q4 2015
91 million
Q1 2016
96 million
Q2 2016
104 million
Q3 2016
113 million
Q4 2016
123 million
Q1 2017
132 million
Q2 2017
138 million
Q3 2017
149 million
Q4 2017
160 million
Q1 2018
157 million
Q2 2018
180 million
Q3 2018
191 million
Q4 2018
207 million
Q1 2019
217 million
Q2 2019
232 million
Q3 2019
248 million
Q4 2019
271 million
Q1 2020
286 million
Q2 2020
299 million
Q3 2020
320 million
Q4 2020
345 million
Q1 2021
356 million
Q2 2021
365 million
Q3 2021
381 million
Q4 2021
406 million
Q1 2022
422 million
Q2 2022
433 million
Q3 2022
456 million
Q4 2022
489 million
Q1 2023
515 million
Q2 2023
551 million
Q3 2023
574 million
Number of Spotify premium subscribers worldwide
In the third quarter of 2023, the number of Spotify premium subscribers reached 226 million worldwide. During the first and second quarter of 2023, there were 210 million and 220 premium subscribers globally. Over the years Spotify has witnessed massive growth since early 2017.
Below is a table showcasing Spotify’s premium subscribers globally from 2015 to 2023.
In 2022, Spotify’s Revenue was more than 11.7 Billion Euros
Premium subscription plays a major role in Spotify’s revenue compared to the ad placements. In 2022, the music streaming app generated more than 11.7 billion euros in revenue, which was higher than 9.67 billion in 2021. This states that more and more users are investing in premium subscriptions.
There are about 317 Million Ad-Supported Monthly Active Users on Spotify
Spotify offers both free and subscription plans through which users can effortlessly enjoy their favorite music whenever they want. The free plan includes various unskippable ads along with the inability to access the full range of features provided by Spotify.
The first quarter of 2023, contained about 317 million monthly active users which is higher compared to the previous year which contained 295 million, on a free and ad-supported plan.
Spotify Users Statistics
Females Make Up 56% of Spotify’s User Base in the U.S.
Data shows that the majority of Spotify’s User Base in the United States are Females with about 56%, while males are just 44% of Spotify’s users. However, with the popularity of Spotify increasing every day we can expect the ratio of male users to increase in time.
Gender
Percentage of users
Female
56%
Male
44%
Distribution of Spotify’s Users in the United States
The majority of Spotify’s audience is inclined towards the younger generation like Gen Z and millennials. The largest age group that access Spotify for music and podcasts is between the ages of 25 and 34 with 29% of users.
Age Group
Percentage of Users
18 to 24
26%
25 to 34
29%
35 to 44
16%
45 to 54
11%
55+
19%
30% of United States users access Spotify Every Month in 2021
It was reported that around 30% of Americans were using Spotify every month in 2021 rising up by 1% compared to the previous year. Regardless of 1% being a slight increase, it does showcase that every year streaming platforms are gaining more users. It also witnessed a rise in weekly usage as well between the years 2020 to 2021. The weekly Spotify usage was increased from 22% to 28% which is a pretty good increase.
Wrapping Up
There is no doubt Spotify is dominating the music streaming platform with its excellent features and capabilities. Spotify is witnessing constant growth in its monthly active users worldwide and is expected to keep growing every year.
In 2022, Spotify contained a revenue of 11.7 billion euros with the premium plans playing a major role compared to ad placements. Above we have listed down Spotify’s Statistics as of 2023 through which you understand the true impact of this music streaming platform globally.
For a comprehensive look into the vibrant and dynamic world of short-form videos and music discovery, check out our detailed article on TikTok Statistics.
Snapchat is an excellent social media platform that allows users to send instant messages, upload photos and videos, and much more. Its eye-catching filters, 1 to 10 seconds viewable photos and videos, creative tools, etc have made it one of the most loved social media platforms among Millennials and Gen Z which has made Snapchat the 5th most popular messaging app in the world.
Today, Snapchat is not only an impressive platform where users can share messages and post pictures and videos but also a useful platform for sharing your ads and promoting your business. Businesses across the world are accessing Snapchat to promote their product and reach their target audience by sharing their ads on this platform.
In this article, we are going to take a look at Snapchat Statistics as of 2023 worldwide including its usage statistics, Distribution of Snapchat users, Snapchat Demographics Statistics, and much more. So, let’s begin.
Snapchat Key Statistics
In 2022, Snapchat generated $4.6 billion in revenue, a 12% increase year-on-year
75% of Gen Z and Millennial accesses Snapchat in the US.
In 2022, the Snapchat app was downloaded about 330 million times out of which 54 million downloads came from the US market.
More than 5 billion snaps are generated on a daily basis on Snapchat.
The Market capitalization of Snap Inc. is worth $118.99 billion.
About 2.4 million snaps are shared almost every minute.
An Average Snapchat user spends about 30 minutes online on the platform.
India is the leading country with the highest Snapchat audience of 182.35 million.
In 2022, Snapchat didn’t record an annual profit, and it made a net loss of $1.4 billion.
More than 397 million individuals access Snapchat on a daily basis out of which 26% of users are based in the United States.
There was a rise in Snapchat’s stock value by over 350% from 2020 to 2021. However, since then it has witnessed a decline of 70%.
Snapchat Overview
Launch Date
September, 2011
Headquarters
Santa Monica, California, United States
Founders
Evan Spiegel, Bobby Murphy, and Reggie Brown
Type
Photo sharing, Instant messaging, Video chat, Multimedia
Available In
37 languages
Snapchat Usage Statistics
Number of daily active Snapchat users from 2nd quarter 2014 to 3rd quarter 2023
As of the third quarter of 2023, Snapchat had 406 million daily active users globally, rising up by 9 million from the second quarter of 2023 which had 397 million daily active users.
Snapchat is ranked the 9th most popular social networks worldwide by number of monthly active users
As of October 2023, Snapchat was ranked the 9th most popular social network globally with over 750 million monthly active users. Snapchat was ranked higher than Twitter/X and Pinterest in this list. (Statista)
42.3% of the Snapchat audience uses the platform for posting images and videos
According to Hootsuite, the majority of audiences on Snapchat use the platform to share their images and videos with their friends and family. While 25.8% of Snapchat users access the tool for sending messages and staying connected with their close ones.
Snapchat was ranked 70+ on the American Customer Satisfaction Index (ACSI)
Snapchat has an American Customer Satisfaction Index of 72 out of 100 points in 2022 and 74 out of 100 points in 2023. Snapchat was ranked higher in ACSI compared to other popular social networking platforms such as Twitter, Instagram, and Facebook. (Statista)
An Average user spends about 30 minutes on Snapchat every day
Globally internet users spend approximately 151 minutes every day on social media platforms. Out of which an average Snapchat user spends about 30 minutes per day based on research conducted by Snapchat itself.
Over 4 billion messages are sent on Snapchat daily
A large section of Snapchat users access this platform to send out messages and stay connected to their family, friends, and colleagues. According to research, around 4 billion messages are sent by snap chatters on a daily basis.
Over 5 Billion Snaps Are Created Per day
According to Snapchat, more than 5 billion snaps are created on this picture and messaging app on a daily basis. Users share a wide range of images and videos with their friends and families every day.
Distribution of Snapchat users worldwide as of January 2023, by gender
Snapchat platform is dominated by women, as 51% of the audience is female while male users access Snapchat 48.2%. (Statista)
Female
Male
51%
48.2%
Snapchat Demographics Statistics
Leading countries based on Snapchat audience size
India has the highest number of Snapchat users by country, with an audience of 182.35 million. The second leading country is the United States with a 108.8 million Snapchat audience.
Below is a table of Snapchat statistics as of 2023 by country:
Percentage of U.S. internet users who use Snapchat
Based on the third quarter of 2020, U.S internet users aged between 15 to 25 were the largest Snapchat-using audience with a total of 48%. The second largest Snapchat user age group is 26 to 35 with 30%.
64% of the snap ads shared on Snapchat are viewed with Sound On
The majority of advertisements shared on social media platforms contain sound, narration, or background music to make the ad more appealing to the audience.
Since 64% of Snapchat ads are viewed with the sound on, there is a good potential for your audio to be heard by the users. However, it is still better to add a short caption or context for anyone who stumbles on your advertisement with their sound off.
55% of Snapchat’s Gen Z users have an Ad recall after watching 0 to 2 seconds of an Advertisement
These statistics clearly say a lot about today’s generation as 55% of the young audience have an ad recall after simply watching zero to two seconds of an ad which is almost double the recall value of users aged 40 or above.
The Estimated Advertising Revenue of Snapchat in 2022 was 4.6 billion U.S. dollars
In 2022, Snapchat generated a total of 4.6 billion U.S. dollars through its advertising revenue. This figure is expected to keep growing further in the coming years and is likely to reach a whopping amount of 8.34 billion U.S. dollars by 2027. (Statista)
Snapchat for Business Statistics
If you are considering enhancing your business and connecting it with a larger audience then Snapchat is the perfect platform for you. Brands from across the world are accessing Snapchat to promote their products and services online by advantage of the platform’s loyalty and highly engaged audiences.
Useful tools such as AR filters and effects provide excellent opportunities for advertisers to get more and more creative and interactive with their target audience which can help businesses promote their businesses at a higher level.
Snapchat users have a global spending power of $4.4 trillion
Snapchat is one of the best platforms where users can enjoy sharing purchases they love along with various shopping moments. The global spending power of Snapchat is $4.4 trillion according to research.
The majority of global spending powers comes from North America which contains a spending of $1.9 trillion followed by Europe with $1.05 trillion. Millennials and Gen Z are considered the highest contributors to the spending power alone with $1 trillion.
Snapchat users are 2x more likely to share their purchases
Word of mouth is one of the best and most effective ways to increase your sales. 65% of the Snapchat audience is likely to post about a product on their stories every time they make a purchase. This has resulted in businesses reaching more and more sales through effective word of mouth. Compared to other platforms, Snapchat users are most likely to share their purchases online.
Wrapping Up
Overall, Snapchat is an impressive application that can be utilized for both entertainment and business purposes. Its creative features allow users to send instant messages, and share their images, videos, and much more.
While also creating an excellent space for businesses and companies to share and promote their product and services and reach their desired target audience. Above we have mentioned all the statistics related to Snapchat as of 2023 that can help you understand the platform better.
TikTok is currently one of the most popular social media platforms worldwide with over 1.7 billion users as of 2023. This short video-sharing tool gained massive popularity in 2020 peaking at approximately 313.5 million downloads during the first quarter.
TikTok was initially launched in 2016 for the Chinese audience but later on, Bytedance decided to roll the app to a wider audience by launching the app in various other countries including the United States, which is today the largest TikTok audience with 143.4 million users.
In this article, we are going to take an in-depth look at TikTok Statistics as of 2023 and talk about the total number of users globally, the largest age group, popular categories, and much more.
TikTok Key Statistics
TikTok has 150 million active monthly users in the United States.
September 2016 (China), August 2018 (Worldwide release)
Headquarters
Beijing, China
Total languages available in
40 languages
Owner
ByteDance
Industry
Social Networking
Number of TikTok users worldwide from 2018 to 2027
In 2023, TikTok counted approximately 1.9 billion users globally. TikTok witnessed massive popularity in 2020 rising from 652.5 million in 2019 to 1,035 million in 2020. Here is a breakdown of the total number of TikTok users worldwide from 2018 to 2027.
Leading Countries with the largest TikTok users as of October 2023
The United States is the leading country with highest TikTok user count of 143.4 million, followed by Indonesia who has a total count of 106.52 million as of October 2023.
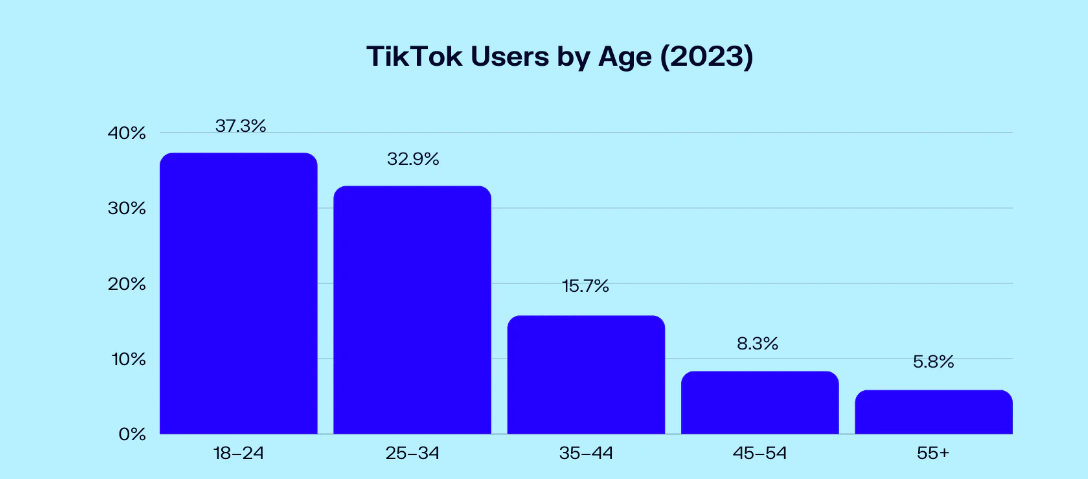
18 to 34 is the age group with largest TikTok users
The short-form video-sharing application TikTok is highly popular among the younger generation. The age group with the highest number of TikTok users ranges between 18 to 34. Below is a table showcasing the TikTok’s user base depending on the Age group:
Age Group
User Percentage
18 to 24
37.3%
25 to 34
32.9%
35 to 44
15.7%
45 to 54
8.3%
55+
5.8%
TikTok Users by Gender
TikTok contains a pretty equal ratio when it comes to the distribution of users by Gender. As of October 2023, approximately 49.2% of TikTok users worldwide were women. While the male users were approximately 50.8% of the total globally. (Statista)
Distribution of TikTok Users based on Age Group and Gender
Now that we are aware that 49.2% of TikTok users are women and 50.8% are male, let’s take a deeper look at the usage of TikTok based on their Age Group and Gender. Here is a table providing an entire breakdown of the total number of TikTok users based on their Age and Gender.
As of October 2023, the age of 18 to 24 was found as the age group with the highest amount of TikTok audience worldwide. A total of 18.2% of women and 18% of the men in the platform audience were between the ages of 18 to 24. The second highest age group was 24 to 34 with 15.2% female audience and 16.9% male audience.
Most Popular Category on TikTok
According to TikTok statistics, “Entertainment” is the most popular category in the short-video sharing platform worldwide. The Entertainment hashtag has a total of 535 billion hashtag views on TikTok.
The second most popular category on TikTok is “Dance” with 181 Billion hashtag views. Below is a table showcasing the overview of some of the most popular categories on TikTok:
Category
Popularity by Hashtag Search
Entertainment
535 Billion
Dance
181 Billion
Pranks
79 Billion
Fitness/Sports
57 Billion
Home reno/D.I.Y.
39 Billion
Beauty/skincare
33 Billion
TikTok is the leading social media platform with the highest engagement rate per post
TikTok has an engagement rate of 17.96 for Micro (users with less than 15K followers) which is much higher compared to Instagram’s 3.86% and YouTube’s 1.63%. Here is a table showcasing the engagement rate of different types of influencers on TikTok in comparison to Instagram and YouTube:
TikTok was named the second social media app that crossed 3 billion all-time downloads. It was reported that there were more than 770 million TikTok app downloads during the first three quarters of 2023. Let’s take a look at some of the additional facts related to TikTok downloads:
In 2022, TikTok was the most downloaded app with 879.2 million downloads globally.
During the second quarter of 2022, Colombia became the leading country with the highest TikTok downloads growth from the App Store.
According to recent market data, it was revealed that TikTok witnessed a global decline in quarterly downloads during the 2nd quarter of 2022 by 37%.
The country that witnessed the most decline was Finland with a total of – 27%.
In the first half of 2021, TikTok has declared the most downloaded non-gaming app with 383 million downloads.
TikTok has more than 1 billion downloads on Google Play Store.
Here is a complete breakdown of the total number of TikTok downloads over the years.
As social media continues to evolve, platforms like TikTok not only shape entertainment trends but also influence tech applications in personal communication. Understanding this intersection can provide insights into user engagement and preferences across different digital environments. For a deeper dive into how AI is transforming personal interactions online, particularly in private communications, explore our discussion on the use of AI sexting chatbots for sex chat here.
TikTok’s growth is part of a wider digital shift reflected across multiple connected trends. Broader social media stats show platforms competing harder than ever for user attention, while screen time stats reveal how much of our day is now spent inside short-form video apps. This rising attention has fueled the creator economy stats showing record growth in monetization opportunities, with TikTok creator stats highlighting how the platform has become one of the fastest paths to building an audience and income online.
Wrapping Up
TikTok is currently one of the most popular social media platforms worldwide with more than 1.7 billion users. This short video-sharing platform is expected to witness more growth in coming years and is expected to reach 2,249 million by 2027 according to Statista.
TikTok is an excellent platform for anyone who wants to promote their brand online considering its excellent engagement rate. We hope this article has helped you gain data about TikTok, its downloads, popular categories, and much more.
For a comprehensive overview of another visual-centric social media platform, check out our detailed article on Instagram Statistics.
Twitter is the 7th most popular social media platform worldwide and positions itself at number 14 in terms of monthly active users. Rebranded as X by Elon Musk, this tool offers a wide range of features and services way beyond just social media that can be utilized by brands and businesses.
Twitter Users Spend 26% Longer Viewing Ads on Twitter which makes Twitter an excellent social media option for marketers and advertisers to promote their product using ads. In this article, we will be mentioning the latest Twitter statistics and trends as of 2023 that marketers should definitely know to run a successful campaign on Twitter.
Twitter Statistics (Top Picks)
Twitter has around 353.9 million users as of January 2023.
The United States is the leading country with the highest number of Twitter users 95.4 million.
Twitter is valued at $41.09 billion as of 2023.
Twitter is ranked the 14th most popular social media platform worldwide in terms of users.
Elon Musk is the most followed Twitter user with 164.2 million followers as of November 2023.
The majority of Twitter’s audience (38.5%) falls under the age bracket of 25 to 34.
The monetizable daily active users of Twitter in the United States is 41.5 million.
An Average Twitter user spends about 30.9 minutes on the platform daily.
Overview of Twitter
Launch Date
21 March, 2006
Headquarters
San Francisco, California
Founders
Jack Dorsey, Evan Williams, Biz Stone, Noah Glass
Current Owner
Elon Musk
Industry
Social Media
Number of X (formerly Twitter) users worldwide from 2019 to 2024
Twitter witnessed the highest users mark in 2022 with 368.4 million users worldwide. However, there was a decline in the total number of X (formerly Twitter) users in 2023. According to Statista, the total number of Twitter users will drop to 335.7 million by 2024.
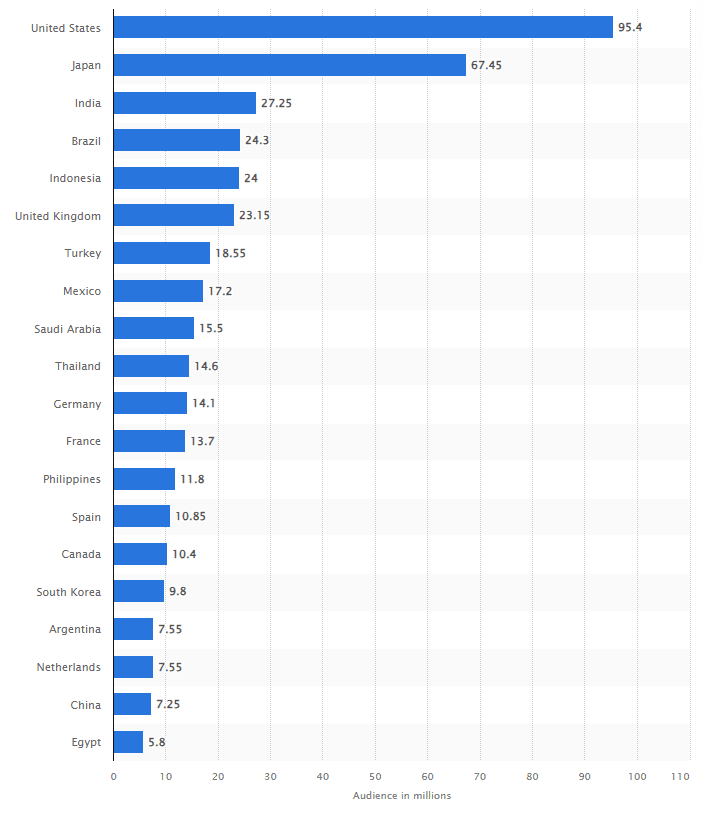
Top countries based on the number of X (formerly Twitter) users as of January 2023
The United States is the leading country with more than 95 million X (formerly Twitter) users as of January 2023. Japan and India are ranked second and third with more than 67 million and 27 million users respectively.
Below is a table of the top 10 leading countries based on the number of Twitter users:
In 2022, Twitter boasted a revenue of $4.45 billion. Two major sources of Twitter’s revenue are its advertising services and its data licensing. In 2021, Twitter made around $4,505 million through its advertising services and around $571.79 million via data licensing.
Elon Musk shared a tweet on Twitter addressing the cash flow of Twitter remaining negative in 2023 with a nearly 50% drop in Advertising revenue along with a heavy debt load.
Below is a table showcasing the revenue of Twitter from the year 2012 to 2022:
Year
Revenue
2022
4,453 million
2021
5,077 million
2020
3,716.2 million
2019
3,458.8 million
2018
3,042.2 million
2017
2,443.1 million
2016
2,529.5 million
2015
2,217.8 million
2014
1,402.7 million
2013
664.6 million
2012
316.8 million
Essential Twitter Statistics
Let’s look at some of the most essential statistics related to Twitter that everyone should be aware of along with its popularity:
10% of Twitter users are accountable for around 92% of the Tweets shared on the platform
The majority of Twitter users aren’t active on the platform and don’t play a major part in tweeting as they are visiting the platform for content consumption rather than creation. In fact, most users on Twitter only send out one tweet every month on average. According to Pew, 10% of Twitter users are only responsible for generating 92% of tweets in the U.S.
48% of Twitter users access Twitter for the Latest news and information
According to Statista, the majority of U.S. users turn to Twitter to get news, entertainment, and various other purposes. Here is a complete breakdown of the main reasons why people use Twitter:
Twitter was bought by businessman and investor Elon Musk for $44 Billion
Elon Musk bought Twitter at a whopping amount of $44 billion on October 27, 2022. The deal was finalized after months of negotiation with Musk himself acknowledging he went out and overpaid for the platform. After taking over Twitter, Musk rebranded Twitter as “X” and introduced a new logo for the platform.
In 2020, the Penetration Rate of Twitter in the UK was 45%
There are a total of 62 million internet users in the United Kingdom, out of which around 17% of individuals were using Twitter in 2020. With a penetration rate of 45% Twitter comes under one of the most popular social media platform choices and isn’t expected to go anywhere in the coming years.
Twitter Usage Statistics
Twitter contains 396.5 Million Users across the world
Twitter has a massive audience across the world regardless of being behind other social media platforms such as Facebook and Instagram.
Various data shows that Twitter contains around 450 million active users worldwide. A recent announcement by Twitter owner Elon Musk claimed that Twitter witnesses about 259.4 million daily active users to check what others are tweeting about or what’s trending.
The United Kingdom has 19.05 Million Twitter Users
The UK alone contains a massive Twitter audience with 19.05 people having a Twitter account as of October 2021. The interesting part is that the majority of the Twitter accounts created in the UK are owned by males, making males the more dominating gender on Twitter.
500 Million Tweets are Sent Every Day
Apparently, over 500 million tweets are sent out every day, meaning around 6,000 tweets are being shared per second and 350,000 per minute. This includes various entertainment news, trending topics, daily conversations, updates, common interests, and much more.
96% of Twitter users reported using the Platform monthly in the U.S in 2020
According to Statista, 52% of the Twitter audience in the U.S. access Twitter on an everyday basis. Overall, 96% of the users responding to Twitter users claimed that they are using the platform monthly.
Twitter User and Demographics Statistics
The United States has the most Twitter users
As of January 2023, the United States was ranked as the leading country with the highest Twitter user count with 95.4 million followers. This list is followed by Japan, India, Brazil, Indonesia, and the United Kingdom.
25 to 34 Year Olds is the leading Age Group on Twitter Globally
According to Statista, twitter’s global audience was composed of 39.5% of users aged between 25 to 34 years old. Here is a complete age distribution of Twitter users across the world:
According to Statista, the majority of Twitter’s audience is male dominated with 63% of male audience and only 37% of female audience on the platform which is a massive gap.
Twitter Limit Statistics
There have been various limiting actions placed on Twitter to reduce the downtime and error pages. Let’s take a look at all the limitations that have been imposed on Twitter accounts:
Only 500 direct messages (DMs) can be sent by a Twitter account on a single day.
Users can only send 2,400 tweets in a single day. (Retweets also count as tweets)
Changes to account email: 4 per hour.
The technical follow limit is 400 in a single day.
Once a Twitter account has hit the mark of following 5,000 other accounts additional follow attempts are limited based on specific account ratios.
To ensure your brand generates a strong presence on Twitter it’s important you beat those algorithms and get your brand to reach the correct audience by investing in advertisements.
This can help users generate awareness, engagement, and conversions and help make your brand stand out and gain a good amount of attention online. Here are some of the Twitter marketing statistics that can help marketers understand the effectiveness of Twitter:
Twitter Users Spend 26% Longer Viewing Ads on Twitter
Twitter is an excellent platform for marketers to share their advertisements as people on Twitter spend around 26% of their time viewing ads. This can help marketers grab attention from numerous users online which can help increase their product sales. So, if you are wondering which social media platform to choose to promote your product then Twitter might be a great choice.
35% year-over-year increase in Global Advertisement Engagement on Twitter
One of the most important parts of Marketing metrics is Engagement for brands to keep track. This provides clear data on users’ interest, likes, and preferences in what you are sharing, while also keeping track of algorithms that your shared content is relevant to others.
Twitter witnessed a total 35% year-over-year rise in terms of global advertising engagement rate, making it more appealing for marketers and advertisers to share their content on Twitter and generate more Twitter advertisements.
Twitter is one of the best platforms for brand interaction as is often seen as more culturally relevant
Twitter is an all-in-one resource for brands and clients and it guides you through all the basics of advertising on Twitter, leads your brand toward excellent success, and helps boost your relevance. Its Agency Playbook also claims that brands that tend to spend more time and energy on advertisement are looked at as more culturally relevant and see more revenue.
Wrapping Up
Overall, X (formerly Twitter) is a great platform to gain knowledge regarding the latest news, entertainment, connecting with friends and family, and more. Regardless of witnessing a downfall in the revenue spectrum, it’s still a pretty effective platform to share your brand advertisement and gain engagement for your business.
The majority of the Twitter audience is males, which makes Twitter a good platform for marketers to advertise male-related products and services as users tend to have 26% Longer Viewing Ads on Twitter. Above we have listed down all the essential statistics related to Twitter as of 2023 that can help you understand the platform better.
Instagram is one of the most-used social media platforms with more than 2.5 billion active users in 2023 which has made it one of the top platforms for marketers and advertisers to promote their products and services.
Launching your marketing strategy on Instagram can be quite challenging if you are unaware of the latest trends, analytics, and stats.
Therefore, it’s important to understand all the insights and statistics of Instagram to ensure your campaign is a success and reaches the right audience. In this article, we will be mentioning top Instagram Statistics as of 2023 that can help marketers create a successful marketing strategy.
General Instagram Statistics
There are over 2.35 billion users on Instagram and it is projected to reach 2.5 billion by the end of 2023.
50.7% of Instagram users are Male and 49.3% of users are female making a pretty even gender split in terms of the audience.
Instagram is the fourth most visited social media service in the world.
In 2020, 95 million Instagram accounts were fake bots which cost brands an estimated $1.3 billion. (GhostData)
Around 85% of Instagram’s audience is younger than 45 years. (Statista)
There are around 127 million Instagram users in the United States itself. (Statista)
Over 900 million Instagram users utilize Instagram Stories every day in 2023. (Earthweb)
The total number of users that could be reached by marketers with advertisements on Instagram increased by around 310 million (+23.5%).
The most followed Instagram user globally is Footballer Cristiano Ronaldo with 612 Million followers.
Instagram Usage Statistics
Instagram Users spend an average of 12 hours every month or a total of 30 minutes every day across the world. (Statista) (Oberlo)
Users in the United States spend around 7.7 hours/month on average using Instagram.
Over 100 million Instagram users watch Instagram Live daily.
Around 66,000 photos are shared on Instagram by users every minute.
Roughly 14% of marketers have been involved in posting live videos on Instagram Live during 2021.
70% of the total Instagram users are below the age of 34 years.
Around 21% of the United States Gen Z adults use Reels on a weekly basis.
As of 2021, it was stated that Gen Z users of Instagram spend around 5 hours on a weekly basis on Instagram.
The Asia-Pacific region is considered as one-third of the total Instagram users.
59% of Instagram users check their Instagram account at least once on a daily basis.
21% of Instagram users login to their accounts on a weekly basis, while only 16% of users log in less frequently. (PEW)
Instagram Active Users
As of January 2023, Instagram’s active users reached 2.5 Billion. Here is a table showcasing Instagram’s active users from 2016 to 2023.
Year
Active Users
2023
2.5 Billion
2022
2.3 Billion
2021
2 Billion
2020
1.3 Billion
2019
1.1 Billion
2018
1 Billion
2017
700 Million
2016
500 Million
Leading countries based on Instagram audience size as of January 2023
Instagram is the 4th most visited social media platform around the world with around 2.5 Billion users. As of January 2023, India contains the largest Instagram audience with 229.55 million users, followed by the United States 143.35 million.
Below is a table showcasing the top countries with the highest Instagram audience size around the world:
Global Distribution of Instagram Users as per Age Groups
Instagram is widely popular for users between the age group of 18 to 44. Teenagers and young adults are the majority of active Instagram users due to its attractive content, exciting and fun reel features, and more.
As of January 2023, the majority Instagram audience were aged between 18 to 24 with 30.8% followed by the age group of 25 to 34 with 30.3%. Users aged 65 and above are the audience with the least Instagram users with 2.6%.
Below is a table showcasing the global distribution of Instagram users as per the age group:
Instagram Reels are short-form videos that have been gaining massive popularity ever since it was first introduced in August 2020. Meta’s CEO Mark Zuckerberg described reels as a significant engagement growth driver for Instagram.
Initially, reels started as a 15-second short video feature but today users can edit up to 90 seconds and gain popularity on Instagram by sharing exciting videos. Let’s take a look at the statistics related to Instagram reel:
2.35 Billion Instagram users interact with Reels every month.
Instagram is expected to reach 2.5 billion monthly active users by the end of 2023 resulting in the reel engagement reaching 2.5 billion people.
India is considered the largest user base for the Instagram reel feature.
The Majority of Instagram Reel audience falls under the age group of 25 to 34 users.
Instagram increased its reel duration from 15 seconds to 90 seconds.
Instagram engagement statistics
A total of 4.2 billion likes are been registered every day on Instagram
There was a 6.47% boost in the average engagement rate on Instagram on Sunday
Instagram videos are capable of generating higher engagement with around 38% compared to photos
The average engagement rate of business accounts on Instagram with less than 10,000 followers is 0.98%
The average engagement rate for photo posts is 0.59%, for carousel posts it is 1.26% and for Instagram reels, it is 1.23%
2.35 billion users interact with Instagram Reels almost every month.
Reels receive 22% more interaction on Instagram compared to standard video posts
On average, there are about 10.7 hashtags that are been used in Instagram posts
The highest Instagram reel engagement rates of accounts with less than 5000 followers are around 3.79%
The weekdays with the highest engagement rate on Instagram are Wednesday and Thursday
Instagram posts with tagged locations have the potential to gain 79% more engagement compared to posts without any tags
Instagram statistics for business
There are more than 200,000 million business profiles on Instagram
Currently, Instagram is one of the most popular spaces utilized by businesses around the world for building audience and marketing purposes. Nearly 15% of the Instagram population are businesses making Instagram a great opportunity platform through which businesses can increase their profit.
44% of Instagram users utilize the social media platform for shopping purposes on a weekly basis
Instagram is an excellent platform that is utilized by businesses. Whether users are truly making purchases or simply browsing through products and services for future purchases, Instagram is a great platform for research and user-friendly shopping.
62.4% of users utilize Instagram to follow and research various brands or products
Instagram is one of the best and most powerful consumer tools for research regarding any business, product, or service. This platform is highly utilized by users to collect information about various brands and products thanks to its user-friendly interface.
July forecast of Hootsuite showcased that 97.6% of US marketers utilized Instagram in 2023
Instagram plays a crucial role in Influencer marketing to engage with their audience by making various marketing audiences. 53.7% of US marketers are using Instagram Reels for influencer marketing in 2023 for its diverse content formats, excellent creator tools, and ability to reach a higher audience.
There is a 70% conversion rate of businesses connecting to local customers using Instagram
According to Meta, businesses that utilize Instagram’s direct messaging feature to connect with local or new customers have a success rate of 70% conversion.
Instagram Product-tagging feature helps increase business sales by up to 37%
Instagram allows users to tag their products and services in their posts and videos through which customers can directly reach the mentioned product in posts or videos making it easier for customers to find their desired product. This has helped in increasing business sales to 37% on average compared to non-tagging peers.
2 out of 3 active users believe that Instagram allows users to build a meaningful connection with the brands
According to Meta, Instagram provides a unique platform through which businesses can connect with their consumers and brands using value-driven content and provide personal and direct customer service for a better experience.
Instagram Statistics for Advertising
Instagram is a powerful tool for Advertising through which businesses can efficiently optimize their profile, create an impactful content strategy, and reach a larger audience through high-quality visuals. Here are the top Instagram statistics for advertising:
Instagram advertisements contain the potential to reach around 849.3 million users.
69% of the budget is spent on influencer marketing by Instagram marketers to promote their products and services on Instagram.
India has the highest Instagram ad audience size with a total of 180 million. The second highest is the United States with 170 million, followed by Brazil with 110 million.
The ad revenue of Instagram stories is expected to increase to $20.03 billion in 2023.
The largest section of Instagram’s advertisement audience ranges between the 18 to 24 age groups.
The advertisement on Instagram stories has a contribution of about 26.7% of the platform’s ad revenue in 2023, rising up from 26.4% in 2022.
83% of consumers have stated they use Instagram to discover new products and services.
Video advertisements have the potential to reach a 3x more engagement rate compared to image posts.
Conclusion
Today, Instagram is one of the most popular social media platforms worldwide. Its excellent unique content formats, excellent creator tools, and ability to reach a higher audience have made it one of the top platforms for businesses and advertisers.
Here you can find millions of audiences with different interests, choices, and preferences and launch your marketing campaign to reach your target audience. Above we have listed down top Instagram statistics that can help understand the impact of Instagram in 2023.
For a deeper dive into the dynamics of ephemeral messaging and multimedia sharing, don’t miss our detailed article on Snapchat Statistics.
Machine learning is completely transforming the business world globally. With Machine learning services businesses in numerous industries can deploy ML-based solutions to enhance productivity, improve customer support, help in decision-making, and much more.
The advancement of AI and ML algorithms helps businesses process massive data easily and enables organizations to process massive amounts of information quickly and efficiently. In this article, we are going to mention top Machine Learning Statistics, along with ML Market size, Adoption statistics, impact on business, marketing, and much more. So, let’s begin.
Machine Learning Key Statistics
Companies can increase the customer satisfaction rate by 10% using Machine Learning according to Forbes.
The Global Machine learning platform market size is expected to reach $31,36 billion by 2028. (Proficient Market Insights)
The United States machine learning market was worth only $100 million in 2018.
The AI market is expected to reach a whopping $500 mark by 2023 and a mark of $1,597 by 2030. (IDC, Precedence research)
76% of surveyed companies were prioritizing Artificial Intelligence and Machine learning over IT initiatives in 2021.
49% of respondents consider Artificial intelligence and Machine learning projects as high priority, and 28% of respondents consider AI and ML as top priority among the IT projects in 2021. (Statista)
By 2030, the forecasted global explainable AI market size is expected to reach $21 billion. (NMSC)
Machine Learning Market Size
The Machine learning market size has been witnessing growth in the last few years. One of the most prominent segments of this market is its deep learning software which is predicted to reach $1 billion by 2025.
Let’s look at the statistics of Machine learning market size to understand the impact of ML today and in the future:
In the first quarter of 2019, the total funding allocated to ML globally was $28.5 billion.
The estimated size of the United States deep learning software market is expected to reach $80 million by 2025.
The machine learning market size is projected to reach $158.80bn in 2023.
An annual growth rate of (CAGR 2023-2030) of 18.73% is expected with the market volume resolution of $528.10bn by 2030.
The United States is expected to have the largest market size in global comparison with $56.75bn in 2023.
$117.19 billion is the global machine learning market expected in 2027 at a CAGR of 39.2% during the forecast period.
Machine Learning Adoption Statistics
The adoption of Machine learning has reached completely new heights with more and more businesses globally implementing ML algorithms to enhance their capabilities. Here are the statistics on how ML adoption is changing the functionality of businesses and companies around the world.
Experts forecast the Global Machine learning adoption rate between 2018 and 2024 to be around 42% CAGR
According to Statista, various businesses are adopting machine learning on a massive scale, with 65% believing that ML technology will be beneficial for analyzing and operating data and making useful decisions.
91.5% of companies have an ongoing investment in Machine learning and Artificial Intelligence
Machine learning is one of the most critical aspects that allows various AI applications and technologies to function and resolve problems. This includes standard deviation observations, speech and pattern recognition, robotics, predicting the stock market’s highs and lows, and much more.
Accessing Machine learning rarely decreases business expenses, but it does help increase the revenue reported by 80% of individuals in a report by McKinsey
Often people expect a decrease in fundamental cost when leveraging machine learning techniques and statistical models. However, accessing machine learning can help increase revenue.
25% of IT leaders state that machine learning programs are capable of helping to curb security risks
One of the top concerns faced by businesses globally is security. Regardless of machines and technology getting more advanced day by day, hackers often find a new way to outmaneuver them and access their private data. However, thanks to machine learning today IT leaders are able to curb security risks in their companies.
33% of IT leaders implement Machine learning to enhance their business analytics processes
Machine learning is crucial for business analytics as companies generate terabytes of real-world data points every second. Applications that leverage machine and statistical learning algorithms are so high in the market today since they assist business owners in better understanding big data.
Machine Learning in Voice Assistants
Machine Learning contains a subset called “deep learning.” It is developed around ML practice and is responsible for generating platforms behind voice assistants including Siri, Google Assistant, and Echo.
Here are some of the statistics related to Machine Learning in Voice Assistants.
The value of the Global Natural language processing market is expected to reach $42.04 billion by 2026.
50% of individuals globally utilize voice assistants which is roughly 3.25 billion.
The Global COVID-19 pandemic impacted the usage of voice assistants as AI usage increased by 7%.
According to voicebot, there was a rise in the usage of voice assistance multiple times a day by 5% in 2022.
Around 80.5% of users under the age of 30 are likely to utilize voice assistants in smartphones compared to 60.5% of users in the oldest age group.
Machine Learning in Business
Machine learning has been embraced globally by numerous businesses and organizations. This technology has been involved in driving innovations in various enterprises allowing them to generate smart processes using AI with learning capabilities.
Here are the statistics of machine learning in businesses.
The productivity of businesses can increase by 54% by leveraging Machine Learning algorithms.
15% of organizations and businesses are already utilizing Machine learning to improve their businesses.
C-level executives are responsible for looking after 75% of AI projects in various firms.
15% of manufacturing businesses claim they are willing to utilize AI in production.
75% of businesses utilize AI and Machine learning to improve customer satisfaction by 10%.
In 2021, there were a total of 4400 funding rounds for Machine learning businesses raising a total of $73.7 Billion from across all rounds.
Machine Learning in Marketing
Machine learning has also impacted the marketing and sales industry by improving the accuracy of lead scoring, improving customer churn prediction, generating pricing models, and much more.
Here are the top statistics about machine learning in marketing to help understand how ML is reshaping the marketing industry.
61% of marketers state that AI and ML is one of the most crucial parts of their data strategy
The demands and expectations of customers have changed. Today users need to interact personally with the customers to gain their attention which requires effective marketing of products and services.
Due to this marketers are investing in Artificial Intelligence and Machine learning to personalize their content and run various campaigns that can help provide excellent user experience to their customers.
87% of Artificial Intelligence adopters states they consider using AI and ML for sales forecasting and improving email marketing
The usage of Machine learning for sales forecasting and email marketing can help fasten customer churn prediction, generate dynamic pricing models, enhance lead scoring accuracy, and much more.
According to a survey conducted by Refinitiv 16% of respondents believed Machine learning is capable of improving the sales and marketing campaigns
Numerous businesses and companies believe that the usage of machine learning algorithms for targeted marketing can be more efficient compared to old-school advertising tactics.
Marketing and sales are considered the most profitable sections to incorporate machine learning systems
Machine learning allows businesses to personalize algorithms to create suitable product recommendations tailored to users who visit the site or platform. These algorithms are derived using numerous data sets on customer behavior which can be helpful to increase customer retention and sales.
Machine Learning for Retail
The three largest areas of Machine learning and Artificial Intelligence in the Retail industry are Personalized design and production, inventory and delivery management, and anticipating customer demand. (PwC)
The Global Artificial Intelligence and Machine learning in the retail market was $8.41 billion in 2022. The market is expected to grow and reach $45.74 billion by 2032 at a CAGR of 18.45% during the forecast duration of 2023-2032. (Precedence Research)
In the United States retail industry is expected to remain the largest AI and ML spending industry from 2021-2025 according to IDC.
Machine learning for healthcare
The Global AI in the healthcare market is expected to reach $187.95 billion by 2030 with a CAGR of 37% from $11.06 billion in 2021. (PwC)
The three leading areas with the highest AI and ML potential in the healthcare industry are ML-based medical diagnosis tracking incidences of diseases, and imagining diagnostics. (Precedence Research, Statista)
North America is the leading AI and ML in the healthcare market accounting for more than 58% of the market share in 2020 and it is forecasted to continue up until 2030. (Precedence Research)
98% of healthcare businesses or organizations already contain an AI strategy or are in the process of implementing one. (Optum)
Wrapping Up
There is no doubt that machine learning is transforming the business world globally and enhancing the productivity of businesses in numerous industries whether it be marketing, healthcare, retail, or more.
Due to this more and more companies are investing in Machine learning. Above we have listed down Machine learning statistics including its market size, Adoption, Impact on business, retail, and much more.
For a deep dive into the data that fuels algorithms and drives the machine learning revolution, check out our detailed article on Big Data Statistics.
Big Data are large sets of Data or information collected through a wide range of sources that can’t be dealt with using traditional data processing application software. Today, most people across the world have access to the Internet.
Every moment you spend online performing a Google search, writing a customer review, watching a YouTube video, or posting any photo or video on a social media platform generates new data.
These data are collected by businesses and companies for customer information, track inventory, manage human resources, and more. In this article, we are going to take an in-depth look at Big Data Statistics, its growth, market size, industry impact, and more.
Big data growth statistics: How much data do we create?
Data is everywhere and we create data every time we perform a Google search online, and every time we post a photo or video on Instagram, TikTok, etc. From smartphones to connected cars, the (IoT) has completely transformed the Data world. The large amount of volume and variety of data coming from excellent velocity is considered Big Data.
Let’s take a look at the statistics of Big Data and how much data is created.
An average internet user generates around 1.7 megabytes (MB) of data per second.
There are 94 zettabytes of data as of 2022
Around 97.2% of businesses are investing or engaging in Artificial intelligence and Big Data.
An average company usually analyzes around 37-40% of their data.
Big Data solutions are utilized by companies to increase their profits by an average of 8%.
The Global Big Data market value is more than $56 billion by annual revenue.
Around 80% of companies and businesses estimate that 50% to 90% of their data is unstructured.
By the end of 2023, around two-thirds of the world’s population will be using the internet.
Market Size of Big Data Industry
The Global Big Data market size is expected to grow to $90 billion U.S. dollarsby 2025 and $103 billion U.S. dollars by 2027.
Internet Users play a huge role in the generation of Big Data. Whether it be accessing a social media tool, sending emails, writing a customer review, or more Big Data is highly influenced by users. Let’s take a look at the statistics of Big Data Users and how it impacts the Big Data industry:
Around 57% of the world’s population utilizes the Internet
Out of 8 billion, more than 4 billion people spent time online in 2019. Apparently, 67% of people use smartphones, while an average of 45% of users are available on at least one social media platform.
About 70% of the world’s data is generated by users itself
A person using their social media account or posting a customer review, sending out an email, etc all plays a crucial role in generating data. Resulting in the majority part of the Big Data being generated by the user itself. More than 900 exabytes are user-generated data.
Over 100,000 Google searches take place every second
Google is one of the highest search engine platforms with an impressive 91.9% share in the Global search market. Apparently, more than 6 million searches take place worldwide every minute with the hourly searches reaching 350 million.
An Average internet user spends around 6 hours and 58 minutes online every day
The Internet has become an addiction in today’s world. Especially with such a high range of apps, devices, and platforms being accessible.
80% to 90% of the Digital Data are Unstructured Data
Unstructured Data are basically those data that aren’t aligned or stored in proper formats or traditional databases. This includes text messages, emails, videos, posts, and much more. However, this data contains essential analytics and insights which are highly important for companies and businesses to gain a competitive edge.
Big Data Statistics Industry-Specifics
Big Data is extensively used in almost every industry whether it be Healthcare, Media & Entertainment, manufacturing, or Education. Let’s take a look at Big Data’s impact based on specific industries:
The Global Big Data in Manufacturing is expected to reach 9.11 billion U.S Dollars by 2026
Big Data is highly utilized by executives in the Manufacturing Industry. In 2018, the Global Big Data in Manufacturing Industry was 3.22 billion. By 2026, the manufacturing industry is expected to witness a huge rise in Big Data by reaching 9.11 billion, exhibiting a CAGR of 14.0% in the forecast period.
Big Data is likely to witness a rise in Supply Chain Management by surpassing around $7.1 billion by 2027 worldwide
Data analytics are highly utilized in Supply Chain Management as they help analyze numerous variables across business operations. It uses advanced analytics to help analyze various materials, products, import/export, and much more.
The overall involvement of Big Data analytics helps manage its assets better and save time and money. With the coming time, more and more companies are likely to invest in Supply chain management.
The Healthcare Market could witness a reach of $79.23 billion by 2028 in Big Data Analytics
Another major industry that highly utilizes Big Data Analytics is the Healthcare industry. It basically helps in analyzing massive datasets of various patients, looking for appropriate treatment plans, recognizing clusters, and much more. The healthcare market has generated $20.12 billion in revenue in 2021 and is expected to keep growing by an average of 28.9% every year.
1,400 Colleges are using predictive analytics to boost graduation rates
Universities with low graduation rates are now turning towards Big Data to assist in spotting trends and predicting the potential struggles faced by students using predictive analytics. Using this Big Data technique, Georgie State has boosted its graduation rates from 23% since 2003.
Streaming Service Netflix saves $1 billion through recommendation algorithms
Big Data plays a massive role in the Entertainment and Media industry and Netflix is the prime example of the impact Big Data has in today’s age. The recommendation algorithm of Netflix (through which various shows and movies get suggested to the users) has apparently influenced around 80% of the content watched on the platform worldwide. This has resulted in the platform saving $1 billion just through recommendation savings.
Around 68% of travel companies have stated they plan on engaging in business intelligence
Big Data has also been reflected in the travel industry and most travel companies are looking forward to investing in the new demands of travelers who are anticipating advanced technological needs. According to Statista, 68% of travel companies are interested in investing in predictive analytics or business intelligence by 2019.
Wrapping Up
The Big Data industry is growing every day, and users produce new data every second through various activities such as accessing social media platforms, customer reviews, Google searches, and more.
Apart from this, Big Data is also indulging in new developments in analytics and data processing, providing more ways to make businesses’ services more accessible and help boost revenue. Above, we have provided an in-depth look at Big Data Statistics involving its growth, market size, industry specifics, and users.
For a deeper dive into the role of AI in processing large data and deriving meaningful insights, check out our article on Artificial Intelligence Statistics.