
We all have interacted with an AI Chatbot at some point in our lives, whether it be raising a query, booking tickets, performing return or exchange requests, and much more.

Today, most companies globally are investing in chatbots to provide personalized customer support to ensure consumers’ queries are solved rapidly with detailed answers, guidance, and information.
In this article, we are going to take an in-depth look at Chatbot statistics including market revenue, Usage Statistics, Marketing and sales chatbot stats, and more. So, let’s get started.
Chatbot Key Statistics
- In 2022, around 88% of individuals have had at least one conversation with a chatbot.
- Chatbots are expected to save businesses 2.5 billion hours of work by 2023.
- In 2019, Chatbots witnessed a 92% use increase, making it the brand communication channel with the largest growth.
- 40% of millennials have claimed to be engaging with a Chatbot on a daily basis.
- 35% of users prefer to use chatbots to resolve their complaints or issues by seeking detailed answers from the bot.
Chatbot Global Statistics
- According to ClickZ, the chatbot industry is likely to reach $1.34 billion by 2024.
- Chatbot Life states the healthcare sector provided by 10% instantly after incorporating chatbots.
- In 2021, various brands are focusing on developing their chatbots instead of their mobile application according to Gartner.
- Facebook conducted a survey through which it was revealed around 79% of users feel confident if they talk directly to a customer agent of a brand instead of a chatbot.
- The utilization of Chatbots is increasing across the world. More than 67% of consumers globally have utilized chatbots for customer support.
- Chatbots are capable of saving up to 30% in customer support costs and assist businesses by speeding up the response duration and responding to 80% of routine questions.
- According to Opus Research, an investment of $4.5 billion was being made in the corporation of chatbots in numerous sectors and industries for improved customer support.
- PwC reported that 27% of customers who are accessing customer support apparently didn’t have a clue whether they were interacting with a chatbot or a human agent.
Chatbot Market Revenue
Below we have mentioned a table showcasing the Global Chatbot Market Revenue from 2018 to 2027. It is estimated that the market revenue generated in 2023 is roughly around $137.6 million. By 2027, the market revenue is expected to witness a huge rise and reach $454.8 million.

| Year | Market Revenue |
| 2027 | $454.8 million |
| 2026 | $325.3 million |
| 2025 | $239.2 million |
| 2024 | $179.9 million |
| 2023 | $137.6 million |
| 2022 | $106.6 million |
| 2021 | $83.4 million |
| 2020 | $65.5 million |
| 2019 | $51.7 million |
| 2018 | $40.9 million |
By Statista
- North America contains a market size of $40.4% and is considered the center of the chatbot startups in the market with the largest share.
- The chatbot market is classified into three main categories: Large, Medium, and small businesses.
- According to AllTheResearch, larger companies are likely to adopt chatbots in a much faster way than small businesses. Their segment tends to account for more than 46% share in the chatbot market and is expected to keep growing in the near future.
- 25% of travel and hospitality businesses globally utilize chatbots to answer any queries or complete bookings.
- The Global chatbot market is divided into different categories such as Marketing, Human Intelligence, and Artificial intelligence. Out of the three categories, Marketing is predicted as the most noteworthy market share, growing at a CAGR of 23.7% by 2030.
Chatbot Usage Statistics
60% of millennials have utilized chatbots and a total of 70% of those users have had a positive experience
According to Forbes, customers have been engaging with self-service options more than a human and using chatbots to solve their queries. 60% of millennials have actively utilized chatbots with 70% of users claiming to have positive responses. Meanwhile, of the rest of the millennials who have not yet used chatbots, more than half claim to be interested in utilizing the chatbot.
The Global chatbot market revenue reached $137.6 million in 2023
According to Statista, the global market revenue generated by the chatbot industry is $137.6 million this year. Over the next few years, the chatbot industry is expected to witness more growth and is predicted to reach a market revenue of $454.8 million by 2027.
By implementing a chatbot, virtual customer assistants help enterprises reduce queries by 70%
Adding chatbots into organizations has created a huge impact in the reporting reduction of up to 70% in call, chat, and email inquiries according to Gartner research. It has also been reported that it has increased customer satisfaction and around 33% savings per voice engagement.
62% of consumers prefer to connect with a bot that waits in line to connect with an agent
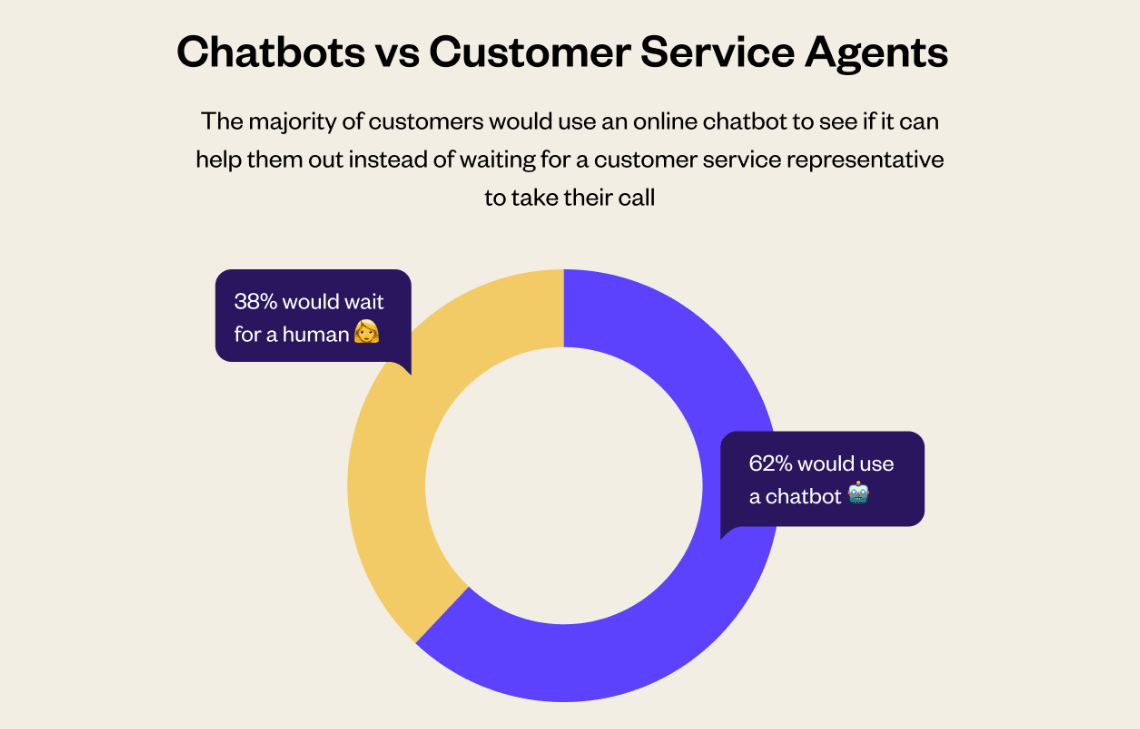
The biggest advantage of chatbots is their “Speed.” Apart from this, chatbots are available 24/7 so users don’t need to spend any time waiting to gain a response or solve their query. Therefore, most users tend to prefer interacting with a customer service bot over a human agent.
Marketing and sales chatbot statistics
- 57% of executives believe that chatbots are beneficial for bringing a significant ROI with minimal effort.
- Around 90% of businesses and companies stated large improvements have been witnessed in the complaint resolution due to chatbots.
- 58% of companies have invested in conversational marketing tools to answer COVID-19 customer support challenges.
- 36% of organizations are turning towards the chatbot market to enhance lead generation and it is said by business leaders that on average chatbot is capable of increasing sales by 67%.
- According to Drift, 55% of organizations that utilize chatbots are likely to get high-quality leads.
Chatbot usage for customer service

Chatbots are predicted to become a primary channel for customer service by 2027 in a quarter of all businesses
According to Gartner, chatbots and virtual assistants are evolving and changing the way organizations respond to consumer queries. These virtual assistants are in high demand by companies and in the coming years these virtual assistants will become a primary channel for customer service by 2027 enhancing the customer experience and driving positive customer emotion at lower cost.
80% of customers have stated they are comfortable using a chatbot if there is a possibility to switch to an agent at a quick speed
According to Simplr, a large number of customers have claimed that accessing chatbots can be pretty annoying since it becomes impossible to reach a customer support agent. They seek an effective system of customer service that contains the efforts of both human agents and virtual assistants.
74% of consumers state that would choose to utilize a chatbot instead of a human age for general queries
Chatbots are capable of answering basic questions and issues raised by customers. Human agents don’t need to engage with routine tasks and even the customers prefer an automated tool as well. 40% of customers don’t care whether it’s a bot or agent answering the query as long as the issue is cleared.
The Future of Chatbots

- In 2023, the sum of chatbot transactions expected is $112B.
- Chatbots are expected to become a prime customer support channel for numerous companies by 2027.
- In the next five years, chatbots are expected to become the most popular customer tech according to one-third of AI startups.
- More and More companies are implementing chatbots into their customer support process and marketing routine. The Global chatbot market is expected to reach $994 million by 2024.
Final Thoughts
Based on the above statistics, it’s clear that chatbots play a huge role in various businesses and are extremely useful. Chatbots are capable of providing excellent customer service to users and the best part is that it provides quick response and is available 24/7.
However, chatbots are a good customer service option when it comes to general queries, but in the case of complex questions, a human agent is essential. Therefore, chatbots cannot essentially replace humans but can be used to complement their human workforce instead of replacing human agents.
To delve into the foundational technology driving chatbots, don’t miss our article on Machine Learning Statistics.


