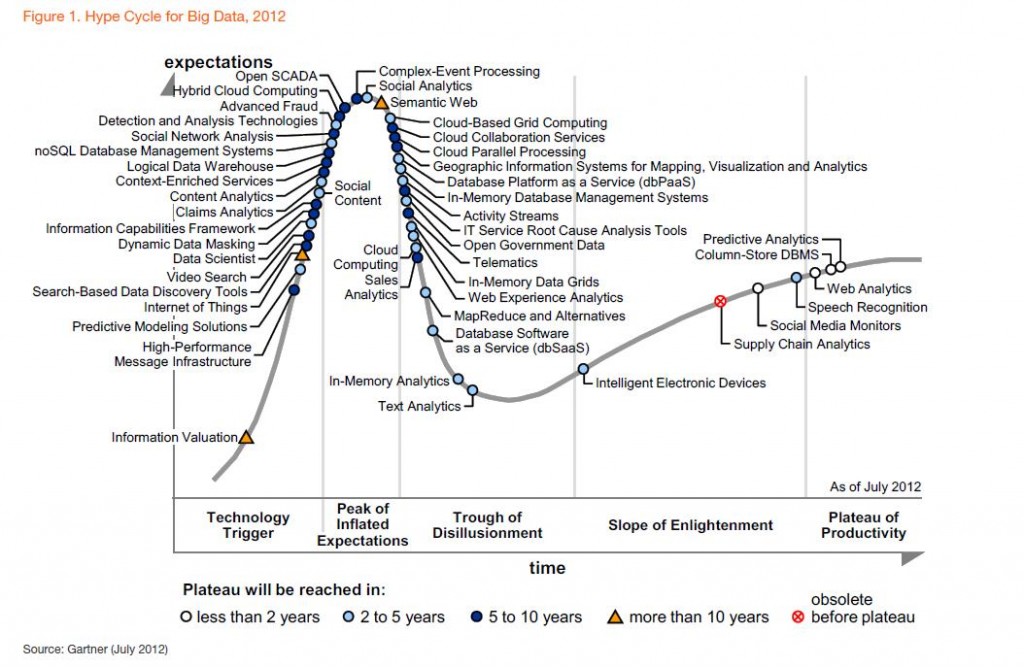
The big data and analytics market will reach $125 billion worldwide in 2015, according to IDC. Both IDC and The International Institute of Analytics (IIA) discussed their big data and analytics predictions for 2015 in separate webcasts last month. Here are the highlights:
Security will become the killer app for big data analytics
Big data analytics tools will be the first line of defense, combining machine learning, text mining and ontology modeling to provide holistic and integrated security threat prediction, detection, and deterrence and prevention programs. (IIA)
IoT analytics will be hot, with a five-year CAGR of 30%
The Internet of Things (IoT) will be the next critical focus for data/analytics services. (IDC) While the IoT trend has focused on the data generation and production (sensors) side of the equation, the “Analytics” of Things is a particular form of big data analytics that often involves anomaly detection and “bringing the data to the analytics.” (IIA)
Adoption of technology to continuously analyze streams of events will accelerate in 2015—it’s all about speed and small units of data. IoT back end as a service (BaaS) will emerge, as players—including Amazon, IBM, and Microsoft—continue to stitch together a wider variety of platform as a service (PaaS) services, including stream processing, data triggers, indexing and synchronization, and notifications, into more tightly integrated offerings directly marketed to the growing community of IoT developers. (IDC)
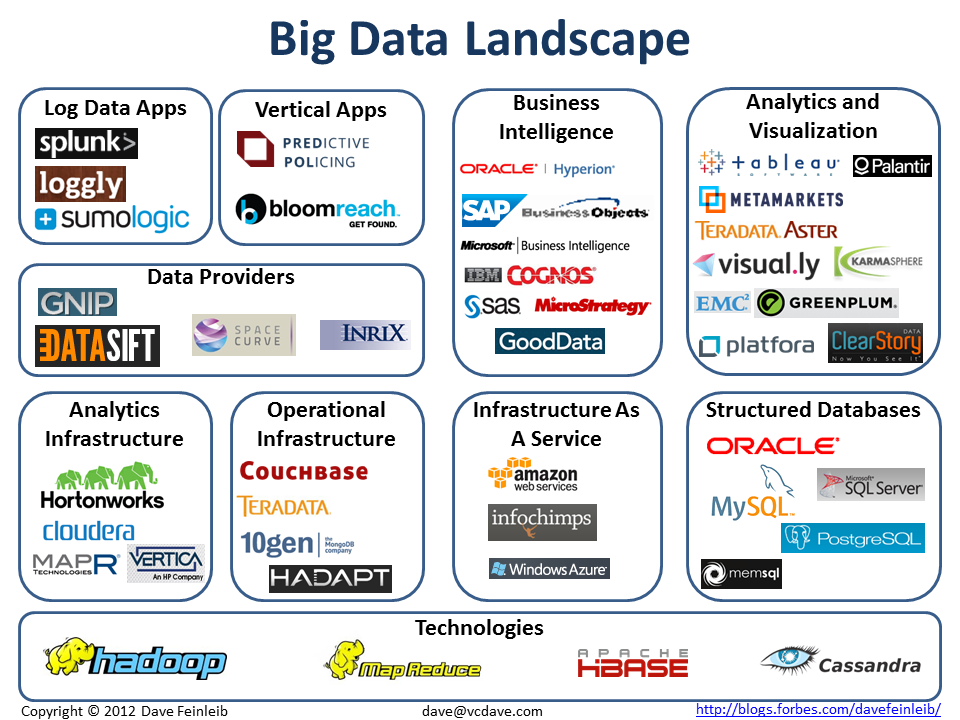
Buying and selling data will become the new business bread and butter
70% of large organizations already purchase external data and 100% will do so by 2019. In parallel, more organizations will begin to monetize their data by selling them or providing value added content. (IDC) Companies will double their investment in generating new and unique data. “You can’t go into a data-based business without some unique data that gives you competitive differentiation.” 2015 will mark an inflection point of intentional investment by mainstream firms in generating and monetizing new and unique data sources. (IIA)
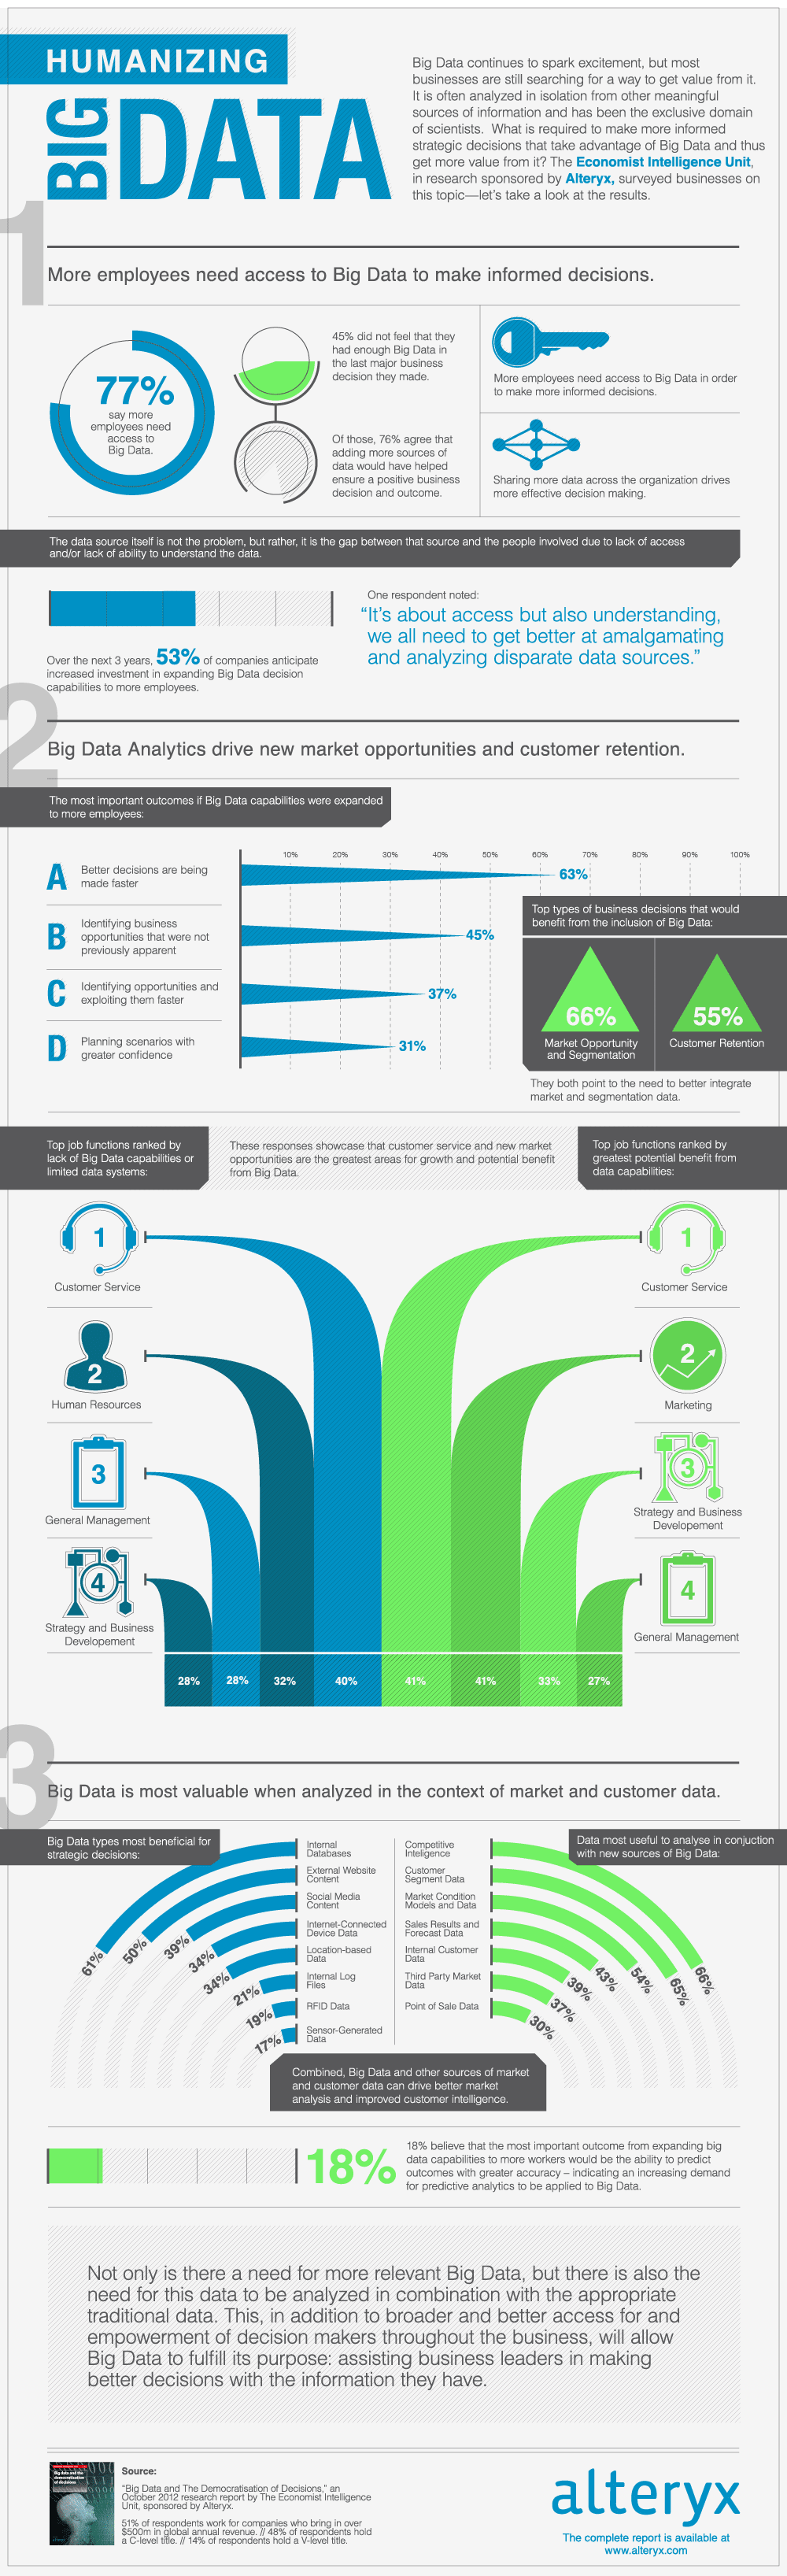
Companies will invest in self-service, automation, and augmentation to answer the skills shortage
Shortage of skilled staff will persist. In the U.S. alone there will be 181,000 deep analytics roles in 2018 and 5x that many positions requiring related skills in data management and interpretation. (IDC—note that data was not provided for the supply side of the equation). Visual data discovery, an important enabler of end user self-service, will grow 2.5x faster than the rest of the market, becoming by 2018 a requirement for all enterprises. (IDC)
Automated decision-making will come of age in 2015 and the organizational implications will be profound. The very way that firms operate and organize themselves will be questioned this year as common workflows become rationalized through analytics. Key to success is the transparency of the automated systems and preparing managers “to occasionally look under the cover” of established models and algorithms. (IIA)
Google’s announced Tuesday an automated statistician research project which aims to build an “artificial intelligence for data science.” But augmentation, rather than automation, may be the better option with knowledge workers. In 2015, companies will begin considering how to augment knowledge work jobs rather than automating them—moving from artificial intelligence to intelligent augmentation. Analytics, machine learning, and cognitive computing will increasingly take over the jobs of knowledge workers, and we will become more conscious of this in 2015. (IIA)
By 2018, half of all consumers will interact with services based on cognitive computing on a regular basis. Current personal services such as Apple Siri, Microsoft Cortana, and Google Now will raise expectations for employees to seek access to similar services in the enterprise. In 2015, PaaS competitors will step up their efforts to compete in the cognitive space. (IDC)
Image, video, and audio analytics will become pervasive
Rich media analytics will at least triple in 2015 and emerge as the key driver for big data technology investment. Already half of large organizations in North America are reporting use of rich media (video, audio, image) data as part of their big data analytics projects, and all large organizations will analyze rich media in five years. (IDC)
Storytelling will be the hot new job in analytics
The most important attribute sought in candidates for big data analytics jobs is communications skills. As organizations run into obstacles in understanding and adopting analytics, they rightly place more emphasis on communication, which is not a strength of most analysts. Companies will increasingly recognize the value of putting an experienced storyteller into the mix (IIA)… possibly looking to fill these positions from the large pool of unemployed journalists?